|
To view this email as a web page, click here. |
 |
|
Welcome
We'd like to invite you to view the presentations from the Matrix Science ASMS Reboot Virtual Breakfast Meetings, describing the latest feature additions and support for complex experiments.
Mascot tip of the month explains how to calculate p-values for quantitation results.
Please have a read and feel free to contact us if you have any comments or questions. |
|
|
|
 |
 |
 |
|
Matrix Science ASMS Reboot Presentations
New features in Mascot Server 2.7
Mascot now has full support for matching peptides with intact crosslinks, as well as improvements to protein FDR, fragment charge states, variable modifications, and merging search results.
 Video Video
 PDF PDF
Identifying intact crosslinks with Mascot Server
A crosslink method defines which linker is used, which sites can be linked, linker directionality, and the expected crosslinked products. Standard Unimod linker definitions are supplied as well as editors for customization. The workflow is demonstrated with a complex from Arabidopsis thaliana, crosslinked with disuccinimidyl suberate.
 Video Video
 PDF PDF
Improved variable modification handling
By adjusting three user definable parameters you can choose to reduce the search depth and speed up searches of lightly modified samples or increase the search depth where site localization matters or for highly modified samples. An example with histone H4 resulted in 81 proteoforms with Mascot 2.6, while this improved functionality in 2.7 yielded 109 proteoforms.
 Video Video
 PDF PDF
Quantitation Summary: exporting protein expression data for complex experiments
Mascot Daemon 2.7 has a convenient way to create a Quantitation Summary from individual Mascot Server or Mascot Distiller result files, suitable for submission to a statistical package to extract meaningful information. The approach is illustrated with data sets from label-free, 8plex iTRAQ, and 10plex TMT experiments.
 Video Video
 PDF PDF
|

|
 |
 |
 |
|
Mascot Tip
When Mascot Distiller reports quantitation results for a protein, it gives a geometric standard deviation for the set of peptide ratios, and the protein ratio is highlighted in bold if it is significantly different from 1. If you would like to have a p-value for the ratio being 1, this can be calculated in Excel without too much difficulty.
In Distiller, choose to create a table_proteins report for the quantitation results. The table is displayed in a child window. Copy and paste the entire report into Excel (CTRL+A, CTRL+C, CTRL+V). For each protein, this provides the values needed to calculate the t statistic (t): measured protein ratio (m), the geometric standard deviation (s) and the sample size (n).
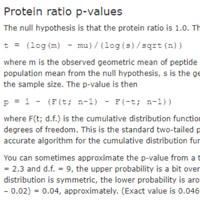
One of the Mascot Server help pages shows the expressions for calculating the t statistic for either an average or a median protein ratio. For example, if the average ratio m = 0.896, s = 1.15, and n = 25 then t = -3.93. The p-value is given by the Excel function T.DIST.2T(ABS(t), n-1). For these values, it is a confident 0.00063. On the other hand, if the sample size was only 5, the p-value would be a more dubious 0.15.
The sample size reported by Distiller is the count of distinct peptides, so if you have values for the same peptide with different charge states, this only counts as one peptide ratio. In most cases, you can get slightly better p-values by exporting with table_peptides, and making a count of the number of peptide ratios, rather than simply taking the count of distinct peptides.
|

|
 |
 |
 |
|
About Matrix Science
Matrix Science is a provider of bioinformatics tools to proteomics researchers and scientists, enabling the rapid, confident identification and quantitation of proteins. Mascot software products fully support data from mass spectrometry instruments made by Agilent, Bruker, Sciex, Shimadzu, Thermo Scientific, and Waters.
Please contact us or one of our marketing partners for more information on how you can power your proteomics with Mascot.
|
 |
 |
|
|