Improving precursor quantitation results with ion mobility filtering
One of the major new features in Mascot Distiller 2.8 is support for raw data files from the Bruker timsTOF instrument. timsTOF combines an ion mobility dimension with QTOF, allowing an additional separation dimension. The instrument can use this to help separate MS/MS spectra from otherwise isobaric peptides.
Mascot Distiller 2.8 can use the precursor ion mobility values for identified peptides as a filter on the precursor scans during the XIC peak detection steps of any precursor-based quantitation method, such as SILAC or Label Free. The aim of this is to clean up and improve the quality of the data in the target precursor regions, removing interfering signal and improving accuracy and giving more reliable quantitation results. For a given peptide match, an ion mobility range is calculated from the identified matches and the precursor ion mobility grouping tolerance defined in the processing options. Only MS1 signals from within the calculated ion mobility range are then used during XIC peak detection.
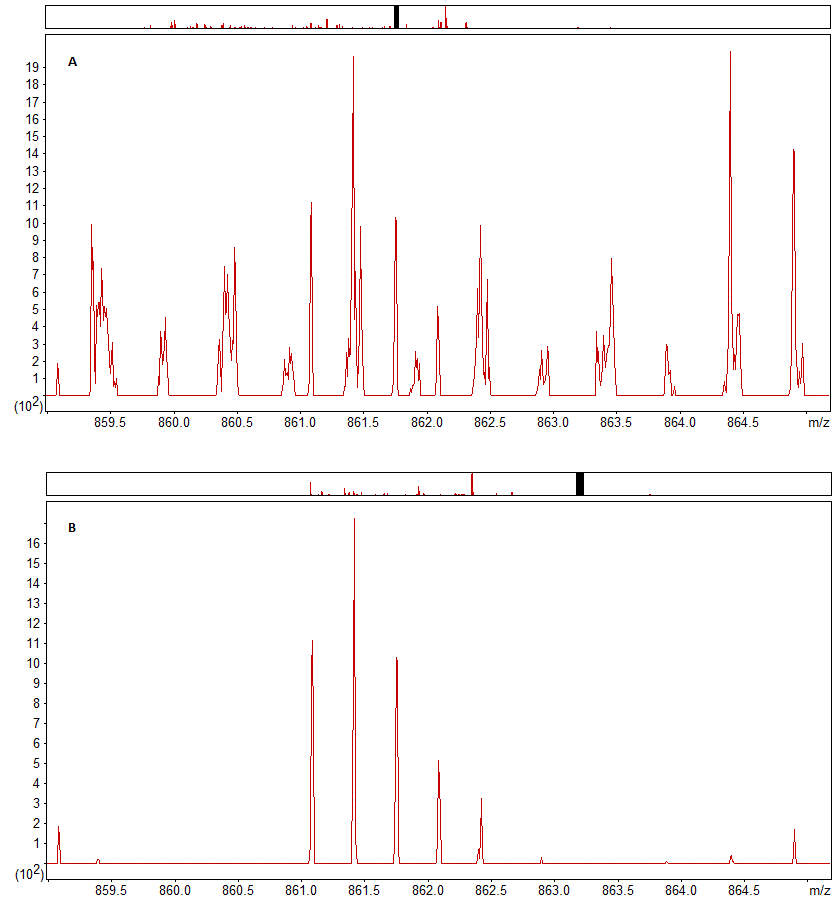
The effect of this precursor ion mobility filtering is shown in figure 1 below, which shows the precursor region for a peptide from one scan of a sample with and without filtering. As you can see, with ion mobility filtering enabled the signal in the precursor area is much cleaner, with far fewer noise peaks, despite this being a very low intensity precursor.

Click to view full size image
Figure 1: The precursor region for a low intensity 3+ precursor with precursor ion mobility filtering (A) disabled and (B) enabled.
The effect of filtering can be observed in both the fraction of the peak area in the precursor region accounted for by the expected precursor peaks and in the correlation coefficient between the predicted and observed precursor isotope distributions for this peptide, both of which improve; increasing from 0.2978 to 0.9234 and 0.6723 to 0.9463 respectively.
In order to enable filtering, the data must be searched using Mascot Server 2.7 with the precursor ion mobility values exported in the MGF peak lists file(s). To enable export of precursor ion mobility values from Mascot Distiller, you must check the option on the “Peak List Format” tab of the “Preferences” dialog for the project, as illustrated in Figure 2 below:

Click to view full size image
Figure 2: The Peak List Format options in Mascot Distiller 2.8 with the option to export precursor ion mobility values in the peak lists highlighted.
If you are using Mascot Distiller as a data import filter for Mascot Daemon, then you need to enable this using the following procedure:
- Log into Windows as a user with Administrator privileges
- Type ‘cmd’ into the Windows search bar
- Right click over ‘Command Prompt’ and click ‘Run as Administrator’
- Navigate to the directory containing MascotDistiller.exe (by default this will be C:\Program Files\Matrix Science\Mascot Distiller)
- Run the following command:
MascotDistiller.exe -batch -daemonMGFIonMobilityParam 1
Example spiked in E.coli sample
To examine the effect of precursor ion mobility filtering we took four files representing two replicates from PXD010012 – these are part of the dataset used in the original PASEF paper1. These samples consist of a background of HeLa protein digest at a ratio of 1:1 with an E.coli protein digest spiked in. The authors reported the median ratio of E.coli spiked in proteins as 4.31.
The selected raw files were processed using Mascot Distiller using the default processing options for timsTOF data and searched twice using Mascot Server – once with precursor ion mobility values included in the peak lists, and once without.
All identified proteins in each search were then quantitated using Mascot Distiller and the peptide ratios normalised using the peptide matches to the 20 most intense identified human proteins. This gave us two sets of results, one where precursor ion mobility filtering was used during quantitation, and one where it was not. Results are summarised in table 1 below:
| Ion mobility filtering disabled | Ion mobility filtering enabled | |
|---|---|---|
| Time taken (hours) | 36 | 10 |
| Median human protein ratioa,b | 0.979 | 1.017 |
| Number of human proteins quantifieda | 4458 | 4946 |
| Median E.coli protein ratioa,c | 4.21 | 4.30 |
| Number of E.coli proteins quantifiera | 718 | 821 |
| Median peptide fraction value | 0.487 | 0.686 |
| Median peptide correlation value | 0.912 | 0.959 |
| Median protein ratio sample size | 5 | 6 |
As you can see, using ion mobility filtering improves the results. Quantitation itself was significantly faster with filtering enabled, because with discrete ion mobility slices being taken, less data had to be processed. Median peptide fraction and correlation values also improved, showing the quality and signal to noise of the data are better with filtering enabled, allowing more peptide ratios to pass the quantitation quality thresholds. The median number of quantitated peptide sequences used to calculate the protein ratios increased from 5 to 6, and more proteins with at least distinct peptide sequences were quantified. The median protein ratios for both human and E.coli proteins are also slightly closer to the expected ratios.
If you already have a licence for Mascot Distiller, then 2.8 is a free update. If not, and you’d to evaluate it, we offer a 30 day trial of Mascot Distiller. For details, please see http://www.matrixscience.com/distiller_download.html
Reference
- Meier F, Brunner AD, Koch S, Koch H, Lubeck M, Krause M, Goedecke N, Decker J, Kosinski T, Park MA, Bache N, Hoerning O, Cox J, Räther O, Mann M. Molecular & Cellular Proteomics 2018, 17(12), 2534-2545. DOI: http://doi.org/10.1074/mcp.tir118.000900
Keywords: ion-mobility, Mascot Distiller, quantitation, timsTOF