MS3 reporter ion quantitation with Mascot Distiller
A common issue encountered when carrying out reporter ion quantitation methods, such as TMT and iTRAQ, is that of interfering ion signals in the reporter region. One strategy which can be taken to mitigate against this is to reisolate the most abundant ion in the MS/MS spectrum and refragment it. The resultant reporter ion signals in the MS3 signal are then almost exclusively from the target peptide. (For example, see Ting et al., Nature Methods., 2011 8(11):937-940, McAlister et al., Analytical Chemistry, 2014, 86(14):7150-8.) Once this has been done, the MS3 spectrum needs to be reintegrated with the peaks from the parent MS/MS spectrum prior to carrying out the search and quantitation.
This page illustrates the procedure. For the full Distiller quantitation help and tutorials, start Distiller and press F1, or open the menu About, Mascot Distiller Help. Please contact us for a 30-day trial.
Configuration
In Mascot Distiller, go to the ‘Time Domain’ section of the ‘Processing Options’ dialog. Under the ‘Group combination’ section, if the ‘No summing’ option is selected, you can choose to move the reporter ion peak region from the MS3 scans into the MS/MS scans. Reporter peaks are moved prior to peak detection, replacing any peaks from the MS/MS scan and leaving you with the ‘clean’ reporter ion peaks from the MS3 scan in the generated peaklist.
For this type of experiment, you should not select the option to sum the entire MS3 scan into the MS/MS scan, since this will not replace the reporter ion region with the values from the MS3 scan; instead it will sum the spectra together and you won’t gain the benefit of the cleaner reporter ions from the MS3. Apart from the reporter ion values, the MS3 scan contains very little additional useful information for the purposes of the Mascot search.
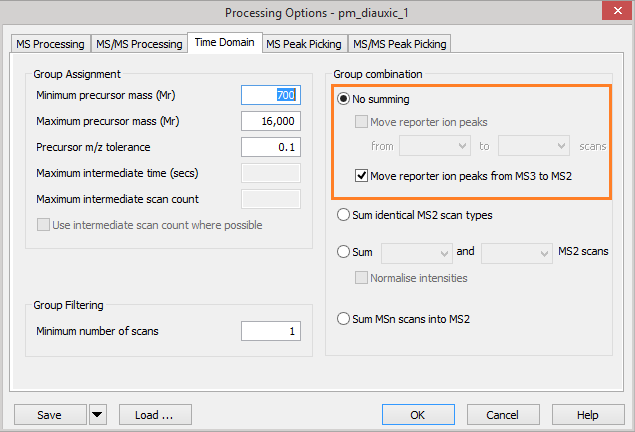
Figure 1: Mascot Distiller processing options for moving MS3 reporter ion peaks into the parent MS/MS scan.
Once peak detection has been carried out, on the peak lists tab in Mascot Distiller, the MS/MS and MS3 scans are grouped together under the ‘Grouped Scans’ node. Figure 2 shows and example of this:
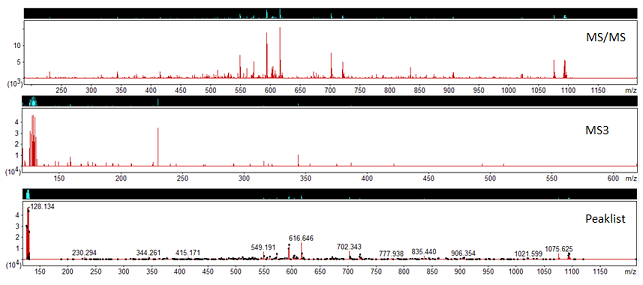
Figure 2: MS/MS, MS3 scans and the processed peaklist.
In this spectrum, the MS/MS scan does not contain any reporter ion peaks, whilst the MS3 spectrum does. If you select the ‘Grouped Scans’ node in Mascot Distiller, we can see that the generated peaklist for this precursor includes the reporter ions from the MS3 scan merged into the MS/MS peaks. When searched in Mascot using the associated quantitation method, the peptide matches will now have the reporter ion quantitation results derived from the MS3 scan, with no post processing required to associate the peptide identification back to the reporter ions.
Example
To demonstrate the negative effect of summing the MS3 and MS/MS scans together, This example uses data from a TMT 6-plex dataset in the PRIDE project PXD005890. The authors had mixed in synthetic peptides, labelled using the TMT reagents in a 3:3:3:1:1:1 ratio against a background of cell lines labelled 1:1:1:1:1:1. The raw data was reprocessed using Mascot Distiller in three different ways:
- Moved only the reporter ion region from the MS3 scans to the MS/MS scans
- Summed the entire MS3 scan into the parent MS/MS scans
- Discarded the MS3 scan
The generated peaklists were searched using Mascot Server against a database comprised of the synthetic peptide sequences and SwissProt using a human taxonomy filter. The mean peptide ratio for each processing method for matches to the synthetic peptide sequences database, calculated using only peptide matches found in all three datasets, are in table 1 below:
| Moved | Summed | MS/MS only |
|---|---|---|
| 2.994 | 2.704 | 1.993 |
Table 1: The mean peptide ratio for matches to the synthetic peptide sequences for each of the three processing methods.
As you can see, the mean ratio using the MS3 reporter ions is very close to the target value of 3, whilst summing the MS/MS and MS3 spectra together does result in the ratio being slightly suppressed. The MS/MS only dataset displays a significant amount of ratio suppression.