Peptide View report
The Peptide View of a matched peptide can be loaded by clicking on a query number hyperlink in a summary report or an ions score hyperlink in Protein View.
Query and protein information
The name of the protein and the 1-letter sequence of the peptide are printed at the top of the page, followed by the query title, if any.
A link is provided to perform a BLAST search of the matched peptide sequence at NCBI. If NCBI is busy, then copy the sequence to the clipboard and follow the final link to a list of alternative BLAST engines.
Mass spectrum displayed in Spectrum Viewer
Spectrum Viewer displays a graphical mass spectrum labelled with fragment ions, e.g. b(6). Note that a small interval around the peptide molecular ion (±2 Da by default) is omitted from the spectrum, reflecting the suppression of these data points in the Mascot search.
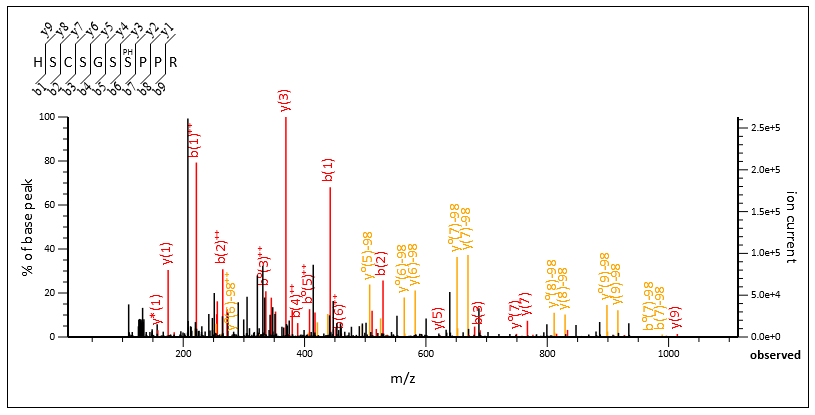
The spectrum display is an interactive SVG graphic that supports zoom and pan. Hover the mouse over a cleavage point in the peptide sequence to highlight the corresponding peaks in the spectrum and vice versa. Drag between two peaks to display mass differences. Controls have tooltip help.
(Spectrum Viewer included in Mascot is based on the Xi Spectrum Viewer, developed by the Rappsilber Laboratory at the University of Edinburgh and released under Artistic License 2.0. Some associated icons taken from Farm-fresh web icons, released under the Creative Commons Attribution 3.0 License.)
The colours used for different components of the SVG graphic can be specified in mascot.dat. For details, search the Installation & Setup manual for SpectrumViewerColourSchemeString.
If the browser does not support the SVG graphic, a simple bitmap is displayed. Click the mouse within the spectrum to zoom in by a factor of 2, so as to show greater detail in crowded regions. Alternatively, controls above the spectrum can be used to specify the plotted mass range directly or reset the mass scale.
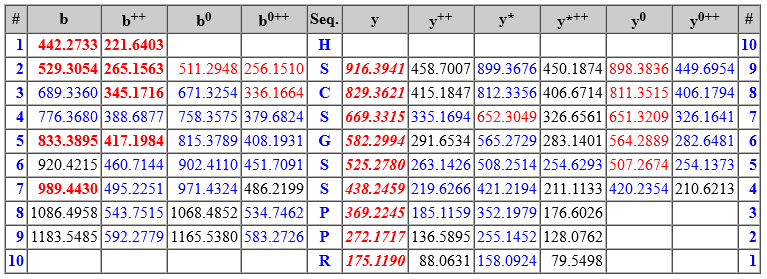
Fragmentation table
The matched fragment ions are shown in tabular format below the spectrum. The ion series are those specified by the INSTRUMENT search parameter. The theoretical masses are calculated based on the peptide sequence, fixed and variable modifications (including fragment neutral losses, if any) and crosslinking (if there is an intact crosslink). Peptide View then highlights all fragments within MS/MS tolerance of an observed peak.
Peak matching works as follows. Mascot begins by selecting a small number of experimental peaks on the basis of normalised intensity. It calculates a probability based score according to the number of matches. It then increases the number of selected peaks, re-calculates the score, and continues to iterate until it is clear that the score can only get worse. It then reports the best score it found, which should correspond to an optimum selection, taking mostly real peaks and leaving behind mostly noise.
The colour coding and formatting is as follows:
Bold italic red means the fragment is in a significant, scoring ion series. An ion series that is bold italic red always contributes to the ions score.
Bold red means the fragment is in a scoring ion series (primary ion series such as a, b, y, z+1). The number of matches in the ion series is greater than would be expected by chance, indicating that the ion series is present.
Red means the fragment matches a peak that Mascot selected during peak iteration. However, an ion series that is not bold read means the number of matches in the ion series is no greater than would be expected by chance, so that the matches themselves may be by chance.
Blue means the fragment matches a peak that is present in the spectrum at low intensity but was not selected during peak iteration. A blue fragment in a bold or bold italic ion series provides additional evidence for sequence coverage, even if the peak intensity was too low for Mascot.
If any residues in the matched peptide have modifications with multiple neutral losses, the table shows the values corresponding to the dominant neutral loss(es). The text immediately above the table gives details. The labels in the spectrum are for all peaks that were selected and matched to obtain the best score, and any neutral losses form part of the label. So, for example, the spectrum might contain peaks labelled y(9) and also y(9)-98. The table will list just one of these values in the y column.
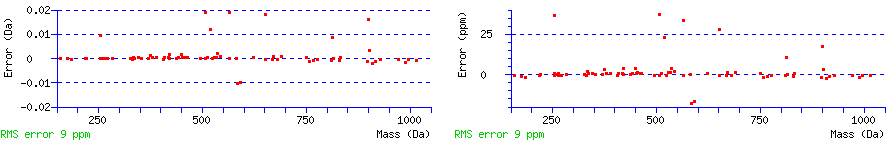
Fragment mass error
A graph displays the mass differences between the calculated and experimental fragment ion mass values in the units used to specify the error tolerance. A second graph shows the same points but with an axis in ppm. The root mean square (RMS) error of the set of matched mass values is given in ppm.
Alternative matches to the spectrum
Finally, the alternative matches to the same MS/MS spectrum are tabulated at the bottom of Peptide View, allowing you to load Peptide View reports for other matches. If the top rank match is significant and contains one or more variable modifications for which alternative arrangements are possible, site analysis information is displayed.