High mass accuracy: fragments
In an earlier post, we looked at the implications for database search of very accurate precursor m/z. In this post, we discuss what to expect from high accuracy measurement of fragment m/z.
It can come as a surprise that the accuracy of the fragment m/z values in an MS/MS spectrum has only a modest effect on the score for a match. In an attempt to explain this, let’s start with a fake, ideal spectrum that has 100% sequence coverage, zero mass error and zero noise. The result of searching this spectrum against the human sequences in NCBInr with a precursor tolerance of 1 ppm and a fragment tolerance of 1 mmu is shown here.
The score is 138 and the expect value is 1.6E-13. This is essentially the upper limit on the Mascot score for a peptide of this length. Go to Peptide View and follow the link at the bottom of the page to do a BLAST search of the same peptide. Add an R to the front of the sequence to approximate tryptic specificity and choose nr and homo sapiens. You’ll find the BLAST identity match has an e-value of 5E-8.
Both the Mascot expect value and the BLAST e-value represent the number of times we expect to obtain an equal or higher score by chance from unrelated or random sequences. It is important to recognise that this involves more than just the quality of the mass spectrum. You could have a perfect mass spectrum of a very short peptide but, if the sequence was so short that it was expected to occur in the database by chance, this would constrain the match to a low score and a high expect value.
The expect value is proportional to the size of the search space, which is very different for these two searches. For Mascot, the number of candidate peptides recorded in the result file is 196. BLAST is not filtering the database sequences by peptide mass. Maybe a reasonable estimate of the number of candidate sequences is to take the count of all possible 12 mers in the database, which is approximately the number of residues, 84.8 million in this case. So, for comparison purposes, we might multiply the Mascot expect value by 84.8E6 / 196, giving 7E-8; very close to the BLAST e-value.
The point of this comparison is to show that it would be hard to justify Mascot reporting a lower (better) e-value for this spectrum, since an ideal mass spectrum cannot contain more information than the explicit peptide sequence. That is, as the quality of a real spectrum becomes better and better, the score will not tend to infinity and the expect value will not tend to zero. They will asymptotically approach the score and expect value for finding the unambiguous peptide sequence in the database. And, in most cases, this is what we observe in Mascot search results.
What happens as the tolerances are relaxed? Repeat the search, changing the precursor tolerance to 100 ppm. The number of candidates increases to 7443 and the expect value increases in proportion, to 6.1E-12. This is less than a factor of 100 because peptide mass values are not uniformly distributed on the mass scale. They cluster around preferred mass values because most peptides have similar elemental compositions. Repeat the search again, increasing the fragment tolerance to 100 mmu, and you’ll find the score is virtually unchanged.
For the reasons discussed above, we are not free to increase the score for the 1 mmu match. If we want to see a more dramatic effect from changing the fragment tolerance, our only option is to penalise the score for 100 mmu match. This, of course, would be unacceptable. If you are an experienced Mascot user, and use target decoy searches to measure the FDR, you’ll be aware that Mascot results tend to be conservative. The last thing we want to do is to knock scores downwards for spectra with lower accuracy on the fragments.
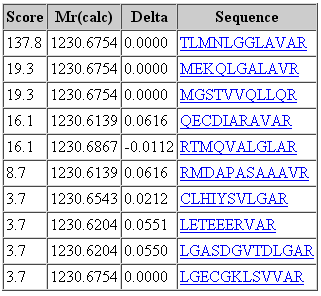
That said, it would be a mistake to think that changing the fragment tolerance has no effect. The dramatic change is found in the score distribution for the random matches, which broadens and shifts to higher scores as the fragment tolerance is increased. For the 1 mmu search, the second best match has a score of 19. For the 100 mmu search, the second best match has a score of 45. In other words, the benefit of high fragment mass accuracy is seen in improved discrimination, with the false, random matches falling away, rather than in a substantial increase in score for the correct match. Going to 1000 mmu makes this trend still more apparent, as can be seen in these screen shots taken from Peptide View reports. Notice how the score for the false match to QECDIARAVR increases as the wider tolerance allows for more fragments to obtain chance matches.

100 ppm precursor, 1 mmu fragment

100 ppm precursor, 100 mmu fragment

100 ppm precursor, 1000 mmu fragment
Of coure, it is artificial to take fake, ideal data and search it with very wide tolerances. If you want to study the behaviour of a genuine spectrum of this particular peptide, here is a high quality example.
Keywords: fragmentation, scoring, statistics
Do you advaise doing the search by changing mass accuracies and accept if the score difference between the top two is large. Then the top scoring peptide is correct.
No, best to search with mass tolerances that are appropriate for the accuracy of the data. The Mascot homology threshold is based on whether the best match is an outlier, which is partly a matter of score difference. For important work, always best to use target-decoy to estimate the FDR and make sure this is acceptable, e.g. 1%. Then, you can accept the matches that are reported as significant without having to make your own estimate from score or score difference.