Predicted RT and fragment intensity in Mascot Server 3.0
A release candidate of the next version of Mascot Server is running on this website. One of the headline features in the preliminary release notes is refining results with machine learning, which includes integration with MS2Rescore. Below is a preview for you to enjoy while we are beta testing the new release.
What is MS2Rescore?
Mascot Server has shipped with Percolator integration for a long time. An earlier article (How does rescoring with machine learning work?) describes the principles of rescoring using Percolator. In Mascot Server 3.0, we wanted to enhance the software by incorporating the latest advances in predictive machine learning, particularly retention time and fragment intensity predictions. We did not want to reinvent the wheel, and instead aimed to select something that has already been validated and has wide acceptance.
Trouble is, there are many rescoring pipelines to choose from. Kalhor et al., MCP 23(7), 100798 (2024) compare 12 recent ones. Every pipeline has its own machine learning models that are mostly incompatible with each other. Most pipelines are open source and in theory, anyone can download and install a pipeline, then pass the database search results to the pipeline for rescoring. In practice, it is often fiendishly difficult to get started. Finding the right package, installing dependencies, system setup (e.g. enabling Docker on Windows), getting the right file format out of the search engine, configuring the pipeline (and what do all the settings mean!), missing DLLs, software crashes, massaging the pipeline output to a format you can use – all of these are an unnecessary hurdle.
Our goal is simply that you, the user, should be able to click a button in Mascot to make your results better. To do this, we have integrated MS2Rescore, which is a “Modular and user-friendly platform for AI-assisted rescoring of peptide identifications”, developed at the University of Ghent. The integration means that MS2Rescore is installed as part of Mascot, everything is configured and Mascot takes care of formatting data for the pipeline and reading back results. The results are displayed in Protein Family Summary and can be exported using standard formats like Mascot CSV, mzIdentML and mzTab.
MS2Rescore has been around for a few years and has been shown to provide a big sensitivity boost in ‘difficult’ data sets, like immunopeptides (Declerc et al. MCP 21(8), 2022). It’s not limited to immunopeptides specifically and can be used with any data set.
MS2Rescore includes two prediction systems. DeepLC is a “retention time predictor for (modified) peptides that employs Deep Learning”, while MS2PIP provides “Fast and accurate peptide fragmentation spectrum prediction for multiple fragmentation methods, instruments and labeling techniques”. What sets them apart from many other ML predictors is that they are able to make accurate predictions for variable modifications not seen in the training step. MS2PIP has also been shown to work well with a range of collision energies, unlike tools like Prosit that are CE dependent (Gabriels et al., Nucleic Acids Research 47(W1), 2019).
Yeast example, CPTAC study 6
Mascot Server ships with a small yeast example search from CPTAC study 6. The sample contains Sigma UPS1 proteins spiked into a yeast background. Although the search is small (8675 spectra), it makes a great example because the data are high quality. It’s also an uncomplicated routine analysis of the type done the world over – but as you will see below, even routine analyses can be improved with the right software enhancements.
This file was acquired with Thermo LTQ-XL-Orbitrap using a 4h gradient (full SOP is in the supplementary information of Paulovich et al., MCP, 9(2):242–254, 2010). The raw file was peak picked with Mascot Distiller. We set up the 50 Sigma UPS proteins as a database (Sigma_UPS) and searched the data against contaminants, Sigma_UPS and the S. cerevisiae proteome. You are welcome to browse the search results.
The below table compares Mascot Server 2.7, 2.8 and 3.0 using the best settings available in each version. The database search parameters and the MGF peak lists are identical; only the software version changes. This is a very simple search with Carbamidomethyl (C) as fixed mod and Oxidation (M) as variable mod.
| Mascot Server | Unique sequences | Sequence FDR | Protein hits | Protein FDR | Capabilities | Limitations |
|---|---|---|---|---|---|---|
| 2.7 | 2702 | 0.59% | 759 | 1.84% | Percolator 3.0; unoptimised features | Cannot get to 1% sequence FDR |
| 2.8 | 2768 | 0.98% | 763 | 3.15% | Percolator 3.5; optimised core features | Cannot use predicted features |
| 3.0 (beta) | 3431 | 0.99% | 863 | 3.36% | Percolator 3.5; optimised core features; MS2Rescore, DeepLC, MS2PIP |
The figures above are for 1% sequence FDR, which is a stricter threshold than 1% PSM FDR. In fact, sequence FDR will be the default in Mascot Server 3.0.
Mascot Server 2.7 is unable to reach 1% sequence FDR when Percolator is enabled, because the sigthreshold format control had various bugs. In Mascot Server 2.8, we spent a lot of time optimising the core features calculated by Mascot. This resulted in a good improvement with difficult data sets like endogenous peptides, but not much improvement with this simple yeast search.
However, predictive machine learning in Mascot Server 3.0 provides an incredible boost. The models selected here are:
DeepLC: full_hc_unmod_fixed_mods, because the training data were tryptic yeast peptides with a 4h gradient (full list of DeepLC models). The CPTAC data were acquired using a 135 min gradient, and the model with 4h gradient is a good match (see further below!).
MS2PIP: CID, because the CPTAC yeast data were acquired with LTQ-XL-Orbitrap (full list of MS2PIP models). The CID model has actually been trained on the NIST CID Human spectral library, which is a very high quality, curated collection of CID spectra from a range of instruments.
How do you know it’s working correctly?
Machine learning isn’t magic. In fact, a lot of things can go badly wrong. Current technology always gives a prediction for a given peptide sequence and variable modifications, but even state of the art tools can make a wrong prediction.
Mascot Server 3.0 will include a machine learning quality report, which helps answer questions like: Did I choose the right model? Are the predictions any good? The link is in the Sensitivity and FDR section of Protein Family Summary (example for the yeast + UPS data).
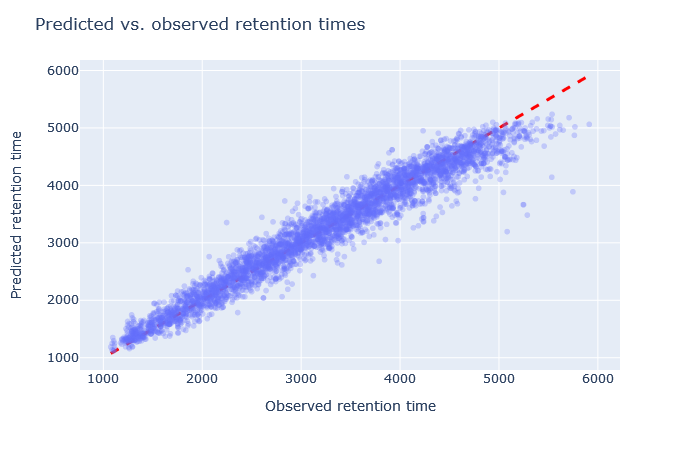
In the example yeast data set, the scatterplot of predicted and observed retention times is spot on, shown above. The scatterplot only shows significant matches in the target database (not decoy matches). There are always outliers, but what matters is the tight bundling along the diagonal line. With MS2PIP, the CID model predictions have median correlation 0.88, which is very good. Many other aspects can be confirmed from the machine learning quality report, and the choice of models is very appropriate for this data set.
The explanation for the high improvement in sensitivity at 1% FDR is simply that incorrect matches with a large difference to predicted RT have been suppressed by semi-supervised machine learning. Correct matches whose predicted RT is close to the observed RT are boosted.
There’s a lot more to be said about selecting models and evaluating the choice, which will be explored in a future blog article. Mascot Server 3.0 is currently in beta testing, and the release will be announced in our monthly newsletter when it’s ready.
Keywords: DeepLC, machine learning, MS2PIP, Percolator, scoring