Exploring protein inference
The Protein Family Summary report is the default for MS/MS searches. It uses a novel hierarchical clustering algorithm for protein inference. This page is a tutorial that illustrates various details of protein inference.
Open the example MS/MS search in a new browser window or tab. This is the mouse data set used in the ABRF iPRG 2008 study.
Dendrogram: similarity between proteins
Family 3 has 3 members. Expand it by clicking on the family number link.
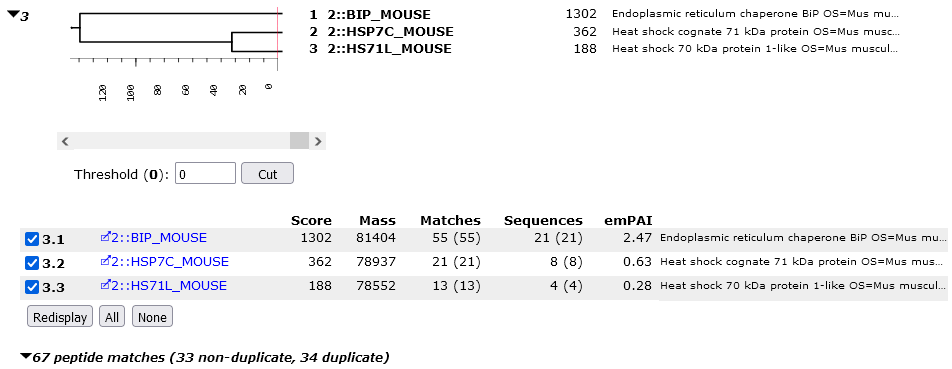
The dendrogram illustrates the degree of similarity between members of a protein family. The scale is ions score, and HSP7C_MOUSE and HS71L_MOUSE join at a score of approximately 30. This represents the score of the significant matches that would have to be discarded in order to make one protein a sub-set of the other. These two proteins are much more similar to one other than to BIP_MOUSE, which has non-shared peptide matches with a total score of approximately 145.
Note that, where there are multiple matches to the same peptide sequence (ignoring charge state and modification state), it is the highest score for each sequence that is used.
Family members and sameset proteins
Immediately under the dendrogram is a list of the proteins. In family 3, because SwissProt has low redundancy, each family member is a single protein. In other cases, a family member will represent multiple same-set proteins.
When there are sameset proteins, one of the proteins is chosen as the anchor protein, to be listed first, and the other same-set proteins are collapsed under a same-set heading. There is nothing special about the protein picked for the anchor position. You may have a preference for one according to taxonomy or description, but all proteins in a same-set group are indistinguishable on the basis of the peptide match evidence.
What separates two family members?
To see the peptides that distinguish HSP7C_MOUSE and HS71L_MOUSE, clear the checkbox for BIP_MOUSE and choose Redisplay. The table of peptide matches will be reduced to rows and columns for just these two proteins, making it easier to compare the matches. A marker indicates that a particular peptide is found in a particular protein.
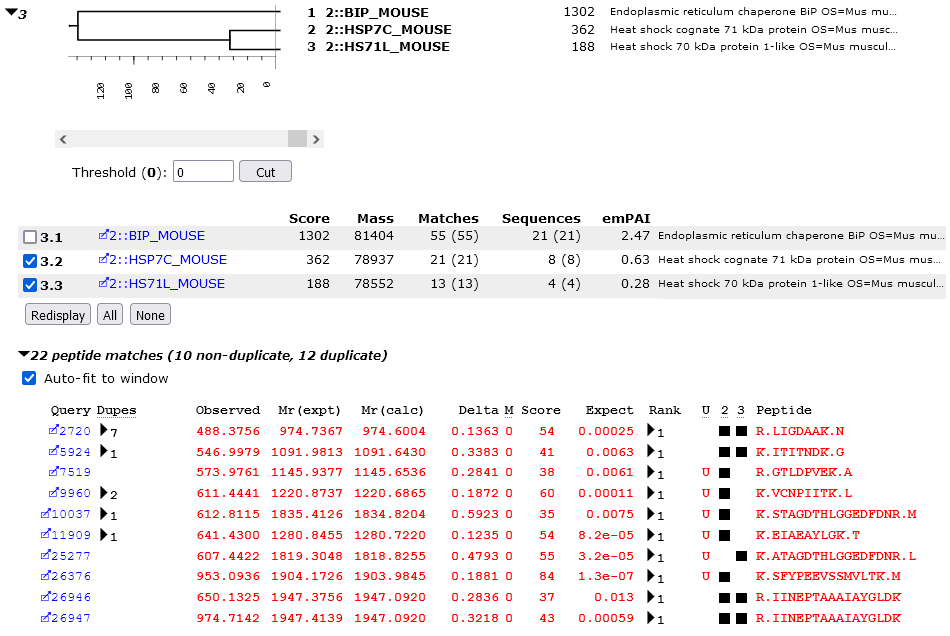
It can be seen that HS71L_MOUSE would be a sub-set of HSP7C_MOUSE if it was not for one match, K.ATAGDTHLGGEDFDNR.L, which is present in HS71L_MOUSE and not in HSP7C_MOUSE. It is the significant score for this match that separates the two proteins in the dendrogram by a distance of 32 (score of 55 – homology threshold score of 23).
If you look a little more closely, you will notice that K.STAGDTHLGGEDFDNR.M has a weak match in HSP7C_MOUSE. So, the evidence for both proteins being present comes down to a single residue. If S221 in HSP7C_MOUSE was an A, or A223 in HS71L_MOUSE was an S, then HS71L_MOUSE would be a sub-set protein. Interestingly, the stronger match is for the sequence found in the protein with fewer matches. This could be chance or it could be that the analyte sequence was essentially HSP7C_MOUSE but with an A at this position.
Cutting the dendrogram
You can "cut" the dendrogram using the controls underneath. By using the slider or by entering a number, set the threshold to 50 and choose Cut. HS71L_MOUSE will be dropped from the dendrogram and the peptide match table because it is now a sub-set protein.
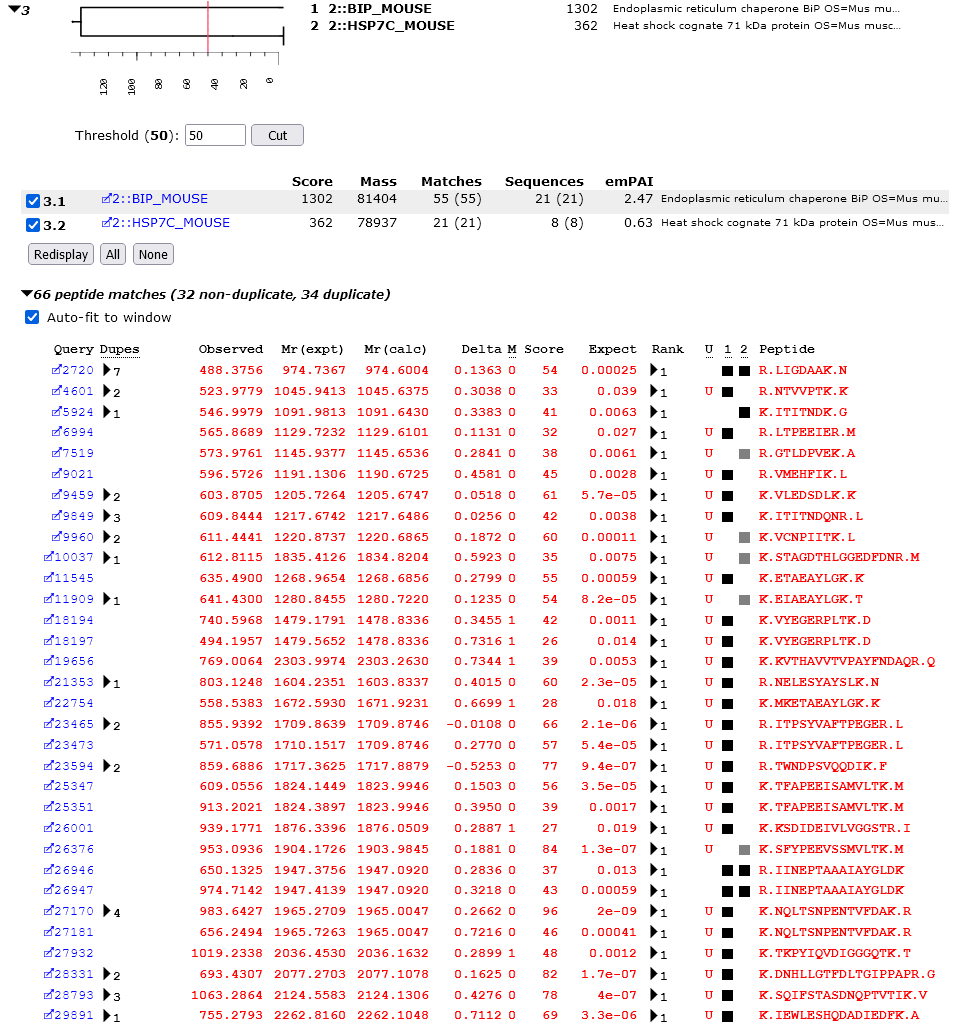
If you compare the matches to HSP7C_MOUSE with those to BIP_MOUSE, it becomes clear that these are very different proteins. They are part of the same family because of two shared matches, LIGDAAK and IINEPTAAAIAYGLD, but many highly significant matches would have to be discarded for either protein to become a sub-set of the other.
In this way, we can quickly deduce from the Protein Family Summary that there is abundant evidence that both BIP_MOUSE and HSP7C_MOUSE were present in the sample. There is little evidence for HS71L_MOUSE. It is more likely that the HSP7C_MOUSE contained a SNP or two relative to the database sequence.