Mascot probability-based scoring
Mascot uses probability-based scoring, which has three components: the database match score, the ‘expect’ value and the significance threshold.
The match score is independent of database size and only depends on spectral quality. In a Peptide Mass Fingerprint search, the score for a protein hit is the probability that the match is ‘random’. In an MS/MS search, the ions score for a peptide match is the probability that the match is ‘random’. The protein score is derived from peptide match scores as a non-probabilistic measure.
Statistical significance depends on the size of the sequence database. Comparing the match score to a fixed threshold is not an appropriate test of significance. The expect value is corrected for multiple testing and varies by database size. Briefly, a match is significant if expect value < significance threshold.
Probability-based scoring is an important foundation but not sufficient on its own. Many journals impose guidelines for the reporting of database search results, designed to ensure that the data are reliable. The current MCP guidelines require:
"For large scale experiments, the results of any additional statistical analyses that estimate a measure of identification certainty for the dataset, or allow a determination of the false discovery rate, e.g., the results of decoy searches or other computational approaches."
You should always set a target false discovery rate to calibrate the significance threshold. The rest of this page explains how Mascot’s statistical approach works.
Null hypothesis and p-values
The database match score uses classical (‘frequentist’) hypothesis testing. The null hypothesis is, the sequence being matched to the spectrum is an unrelated sequence. The p-value is the probability of getting the observed number of matching peaks assuming the null hypothesis is true. In other words, the p-value is the probability of a random match.
A small p-value, like 0.001, means there is evidence against the null hypothesis – the match is unlikely to be random. A p-value around 0.5 or 1.0, on the other hand, means the null is likely true and the match is random. Reporting direct probabilities can be confusing, so the database match score is -10*log10(P), where P is p-value. A probability of 10-20 thus becomes a score of 200.
Significance level
A commonly accepted threshold is that an event is statistically significant if it would be expected to occur at random with a frequency of less than 5%. This is the default significance level.
A hypothesis test can make two kinds of errors, illustrated in the below “Table of confusion”: reject the null hypothesis when it is true (false positive, type I error); or accept the null hypothesis when it is false (false negative, type II error).
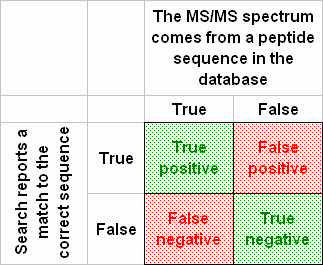
The significance level determines the upper bound for the type I error rate. This is the probability of a false positive match if the experiment were repeated numerous times. You can control the significance level in the summary reports by changing the value in format controls.
There’s no parameter for the type II error rate in Mascot, because there is a large number of possible alternative hypotheses, such as “the sequence is NISQSFTNFSK” or “the sequence is SEDVLAQSPLSK”. The type II error rate can only be determined for a specific alternative hypothesis.
It is important to distinguish between a significant match and the best match. Ideally, the correct match is both the best match and a significant match. However, significance is a function of data quality. It may be that there are just not enough mass values or the mass measurement accuracy is not good enough to get a significant match. This doesn’t mean that the best match isn’t correct, it just means that you must study the result more critically.
Expect value
A sequence database typically contains more than one entry. A database search is almost always performing hundreds or even thousands of trials for each mass spectrum. It is critical to correct p-values for multiple testing.
Suppose the database has 100 candidate sequences and the spectrum is matched against each one. If the null hypothesis is true for all 100 trials – that is, none of them is the correct sequence – you can expect 5 trials to have p-value < 0.05 just by random chance. (This derives from the simple fact that p-values under the null hypothesis have Uniform(0,1) distribution.)
The family-wise error rate (FWER) is the probability of getting at least one false positive match when you do multiple hypothesis tests at a fixed significance level. Mascot controls FWER by reporting the ‘expect’ value of a match. The expect value is analogous to the p-value, except it has been corrected for multiple testing. It is directly equivalent to the E-value in a Blast search result.
For a score that is exactly on the default significance threshold, (p<0.05), the expectation value is also 0.05. Increase the score by 10 and the expectation value drops to 0.005. The lower the expectation value, the more significant the score. When the expect value is greater than one, it can be interpreted as the expected number of times of observing a score at least as extreme, assuming all null hypotheses are true.
When assessing whether a match is significant, you should always compare its expect value to the significance threshold.
False discovery rate
The key modeling assumption with probability-based scoring is that all null hypotheses are true. In other words, we assume all the database sequences are unrelated, so-called true nulls. Obviously this is not strictly true in a real search, where the database is chosen with the goal that the majority of spectra should have at least one “correct” peptide sequence. So, the database search results are a mixture of correct and incorrect matches.
Another assumption is that the peptide sequences are statistically independent. This isn’t always true. For example, when the database is large enough or contains highly homologous proteins, it’s possible to get clusters of peptide sequences that only differ by a small mutation. Scores for these peptides will be correlated, which can skew the distribution of p-values within a query.
The standard approach is to estimate the false discovery rate (FDR), which is the proportion of false positives among all positive (statistically significant) PSMs. Mascot automatically searches the MS/MS spectra using the same parameters against a decoy database that contains only incorrect peptide sequences. As long as the decoy sequences are statistically similar to the target peptides, the decoy matches model the incorrect matches in the target database.
If TP is true positive matches and FP is false positive matches, the number of matches in the target database is TP + FP. The number of matches in the decoy database provides an estimate of FP. The estimated FDR is simply FP / (FP + TP). The classic publication Elias et al., Nature Methods 2 667-675 (2005) contains an excellent explanation of the approach and rationale.
The FDR is a property of the data set, while the FWER is a property of an individual query. The two are connected by the significance threshold. If the data set follows the modeling assumptions perfectly, the FDR is equal to the significance level. This is because the latter specifies the type I error rate, which is the probability of getting false positives (decoy PSMs). When the two differ, the significance level can be adjusted to yield a suitable FDR.
While FDR estimation is an excellent validation method for MS/MS searches of large data sets, it is not useful for a search of a small number of spectra, because the number of matches is too small to give an accurate estimate. Hence, this is not a substitute for a reliable scoring scheme, but it is a good way of calibrating it.
Mass Tolerances
For a Peptide Mass Fingerprint search, if the number of matched mass values is constant, the score will be inversely related to the mass tolerance.
For an MS/MS search, this is not the case. Increasing the peptide mass tolerance will have no effect on the ions score. This is because the ions score comes from the MS/MS fragment ion matches. Opening up the peptide mass tolerance means that Mascot has to test many more peptides, so the search takes longer and the discrimination is reduced, but the ions score remains unchanged.
Of course, if the peptide mass tolerance is set too tightly, in an effort to improve discrimination, one or more of the peptide matches may be lost, which will dramatically reduce the overall score.
How the PMF score is calculated
Observed mass spectra are submitted to Mascot as search queries. For Peptide Mass Fingerprint (PMF) search, the goal is to identify the protein from peptide masses. A query is a peak list containing the observed peptide masses, plus charge state (typically 1+). The search typically has one query, although PMF mixture searches may have a few queries.
In silico digestion
The candidate protein sequence is digested into peptides in silico. Mascot calculates the relative Mass (Mr) for each peptide.
Peak selection and matching
The calculated masses are matched to the observed peaks using a special algorithm, which uses peak intensities as a guide to separate signal from noise. Peak selection and scoring operate in tandem. This is easiest to explain by example.
Suppose the peak list has 50 peaks, each with observed m/z and intensity. These are decharged and sorted by relative mass (Mr), then divided into sets of ten in Mr order. With 50 peaks, that’s 5 sets of ten peaks. The first set has the ten lowest Mr values and the fifth set the largest ten. Among each set, the highest intensity peak is given intensity rank 1, the next highest rank 2 and so on until rank 10.
Mascot first looks at only intensity rank 1 peaks and calculates the score. Then it includes intensity ranks 1 + 2, then 1 + 2 + 3 and so on, and keeps recalculating the score until the score stops improving.
If you submit a peak list without intensities, the masses are still given intensity ranks, but it’s only based on Mr. For example, suppose you have this peak list:
400.5 10
410.3 15
When intensities are present, the second one gets intensity rank 1. When intensities are absent, the first one gets intensity rank 1, simply because it’s the first in Mr order.
The peak selection algorithm achieves two things: It has a high chance of selecting real peaks from among noise peaks, and it selects peaks across the mass range, rather than just selecting the most intense peaks. The score is typically improved when intensities are present, because Mascot might not have to use all the peaks for unambiguous identification.
Calculating the expect value
Mascot counts the number of matching peaks, at the current intensity rank, and calculates the probability of getting as many matches assuming this is an unrelated sequence. The p-value is reported as the score -10*log10(p).
The score threshold is calculated from the significance level (default 0.05) using the Bonferroni correction. Mascot also applies an empirical correction necessary for large sequence database searches.
Finally, the expect value is a function of the PMF score and the threshold. For a score that is exactly on the default significance threshold, (p<0.05), the expectation value is also 0.05.
Example
The Protein Summary page for typical peptide mass fingerprint search (open in new window) reports that "Scores greater than 70 are significant (p<0.05)". The histogram of the score distribution looks like this:
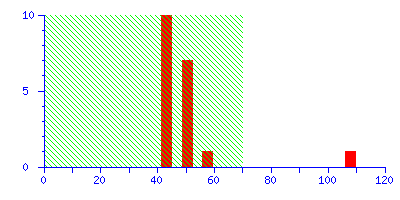
The protein with the high score of 108 is a 26 kDa heat shock protein from yeast. This is a nice result because the highest score is highly significant, leaving little room for doubt.
(It may be useful to think of the score histogram as a highly magnified view of the extreme tail of the distribution of scores for all the entries in the sequence database. In this case, 50 entries out of 561,356. Scores in the green region are inside this tail, and are of no significance. A real match, which is a non-random event, gives a score which is well clear of the tail.)
To illustrate the difference between a significant match and a correct match, try repeating the search in the example, but with the mass tolerance increased from ±0.1 Da to ±1.0 Da. The discrimination of the search is greatly reduced, and the score for the correct match falls just below the significance level:
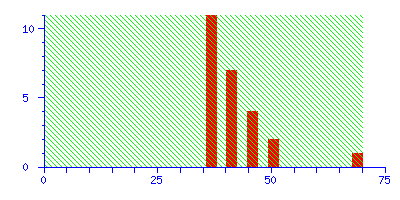
The best match is still correct, but it not significant. If we did 20 such searches, we could expect to get this score by chance alone because there is such a huge number of entries in the sequence database. Increase the mass tolerance to ±2.0 Da, and the correct match is no longer the protein with the highest score.
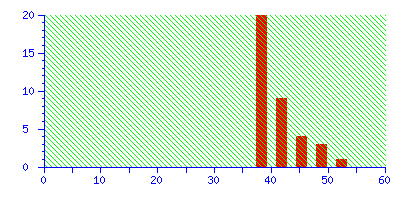
Even if this was an unknown, it is clear from the significance level that this is not a useful match, and there is no danger of this result becoming a false positive.
Limitations
Like any statistical approach, probability-based scoring depends on assumptions and models.
For Peptide Mass Fingerprint search, one of these assumptions is that the entries in the sequence databases can be modelled as random sequences. This is not always a good assumption. Some of the most glaring examples involve extended repeats, such as AAC62527, porcine submaxillary apomucin. Although the molecular weight of this protein is 1.2 MDa, over 80% of the sequence is composed of an identical 7 kDa repeat. It is difficult to know how to treat such cases. If a single experimental peptide mass is allowed to match to multiple calculated masses, then a single experimental mass which matches within a repeat will give a huge and meaningless score. But, if duplicate matches are not permitted, it will be virtually impossible to get a match to such a protein because the number of measurable mass values is too small to give a statistically significant score.
Another assumption is that the experimental measurements are independent determinations. This will not be true if the data include multiple mass values for the same peptide, even if these are from ions with different charge states in an electrospray LC-MS run. Good peak detection and thresholding (in both mass and time domains for LC-MS) are essential for any scoring algorithm to give meaningful results.
How the MS/MS ions score is calculated
Observed mass spectra are submitted to Mascot as search queries. For uninterpreted MS/MS search, the search unit is the peptide. A query specifies the precursor ion m/z and charge state, as well as the observed fragment masses. The search typically has thousands or even millions of queries.
In silico digestion and fragmentation
Mascot digests protein sequences from the chosen database and selects peptide sequences whose mass is within the specified tolerance of the query’s precursor mass. The software calculates predicted fragment masses from the peptide sequence and any fixed or variable modifications.
Peak selection and matching
Even high-performance instruments can give spectra with ‘peak at every mass’ chemical noise. If a search engine simply counted fragment matches, such spectra would give high scores for almost any sequence. Clearly, there has to be some attempt to discriminate between signal and noise, and you cannot just take the most intense peaks in the spectrum because there are often strong systematic intensity variations across the mass range. Low mass fragments may be much more intense than high mass fragments.
The approach taken in Mascot is to divide the spectrum into 100 Da wide segments and select the most intense peak in each segment. This is intensity rank 1. The score for this set of peaks is determined, then next most intense peak in each segment is added to the set (intensity rank 2) and the score re-determined. Iteration continues, taking additional intensity ranks, until it is clear that the score can only get worse. The best score found is reported, which hopefully corresponds to an optimum selection, taking mostly real peaks and leaving behind mostly noise.
The weighted average amino acid residue mass in a database such as SwissProt is around 110 Da. The rationale of using segments of width 100Da is that we cannot be sure which ion series will be present in a spectrum, but it would seem reasonable to assume that the number of real peaks will be some small multiple of the number of 100 Da intervals.
Calculating the (uncorrected) p-value
The probability that the match is random is calculated using several factors:
- The count of matches in each ion series
- The residue coverage given the count of selected peaks and matched fragments
- The amount of unmatched intensity
As more peaks are selected, the number of fragment matches may keep increasing, but at some stage, the score will start to decrease. This is because the number of trials matters as much as the number of matches – trials being the number of experimental peaks selected. Getting 12 matches from 20 peaks will usually give a higher score than 14 matches from 30 peaks, although you cannot say for sure without taking parameters such as mass tolerance and the number of possible matches into account.
Score thresholds
The p-value that the match is random, calculated above, must be corrected for multiple testing.
During a search, if 1500 peptides fell within the mass tolerance window about the precursor mass, and the significance threshold was chosen to be 0.05, (a 1 in 20 chance of being a false positive), the corresponding score threshold should be -10Log(1/(20 x 1500)) = 45. Extensive testing with large target-decoy searches showed this to be too high, and the identity threshold displayed in reports has always had an empirical correction of -13 applied.
If the quality of an MS/MS spectrum is poor, particularly if the signal to noise ratio is low, a match to the "correct" sequence might not exceed this absolute score threshold. Even so, the best match could have a relatively high score, which is well separated from the distribution of 1500 random scores. In other words, the score is an outlier. This would indicate that the match is not a random event and, if tested using a method such as a target-decoy search, such matches can be shown to be reliable. For this reason, Mascot also attempts to characterise the distribution of random scores, and provide a second, lower threshold to highlight the presence of any outlier. The lower, relative threshold is reported as the homology threshold while the higher threshold is reported as the identity threshold.
The identity threshold is still useful because it is not always possible to estimate a homology threshold. If the instrument accuracy is very high or the database is very small, there may only be a small handful of candidate sequences, so that it is not possible to say whether a match is an outlier.
Finally, the expect value is a function of the ions score and the score threshold. For a score that is exactly on the default significance threshold, (p<0.05), the expectation value is also 0.05.
Example
These two spectra get the same score, but the signal to noise characteristics are rather different.
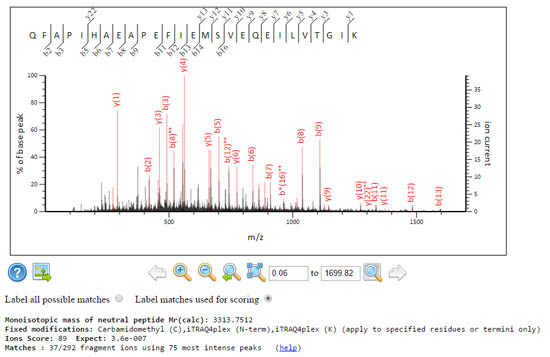
A grassy spectrum where Mascot had to dig deep and use the 75 most intense peaks, to get 37 fragment matches. The expect value is very good, 3.6e-07.
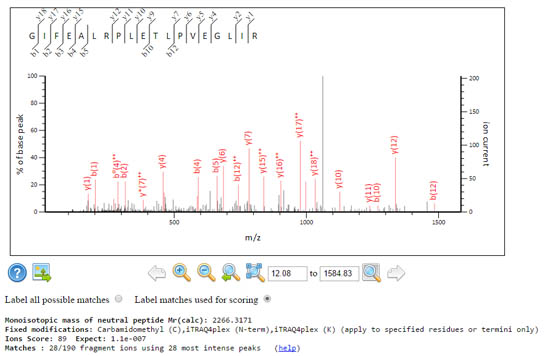
A sparse spectrum where Mascot only had to use the 28 most intense peaks to get 28 fragment matches, which yields the same score and a comparable expect value 1.1e-07 despite using fewer peaks.
This approach to selecting peaks is rugged and can handle a wide range of data characteristics. It’s no good to attempt too much processing on the peak list, because what works well in one case can cause damage in other cases. The best way to improve the ions score is good quality peak picking, which is also the correct place for de-charging and de-isotoping of high quality MS/MS data.
Protein scores
The protein score in the result report from an MS/MS search is derived from the ions scores. Unlike PMF scoring, this protein score is not a probabilistic estimate. It is simply a convenient way to sort the protein hits before protein inference.
The protein score uses the highest-scoring match for each distinct sequence. That is, duplicate matches are excluded and only the highest one retained. Only statistically significant matches are used, meaning the peptide score must exceed the threshold. The protein score is the sum of (score – thr) of these matches, where thr is the score threshold of the corresponding peptide match, plus the average threshold of the peptide matches.
The protein score in MS/MS searches causes frequent misunderstandings, which are elucidated in common myths about protein scores.
How the sequence query score is calculated
A sequence query may lack MS/MS data, and instead has a combination of filters and qualifiers.
Amino acid sequence or composition information, if included as seq(…) or comp(…) qualifiers, is treated as a filter on the candidate sequences. Ambiguous sequence or composition data can be used (in a manner similar to a regular expression search in computing) but it still functions as a filter, not a probabilistic match of the type found in a Blast or Fasta search.
In contrast, tag(…) and etag(…) qualifiers are scored probabilistically. That is, the more qualifiers that match, the higher the score, but all qualifiers are not required to match.

- Probability-based scoring
- Null hypothesis
- Significance level
- Expect values
- False discovery rate
- Mass Tolerances
- PMF score calculation
- In silico digest
- Peak matching
- Expect value
- Example
- Limitations
- MS/MS score calculation
- In silico digest
- Peak matching
- Calculating p-value
- Score thresholds
- Example
- Protein scores
- Sequence Query Scoring