Some peaks are more equal than others
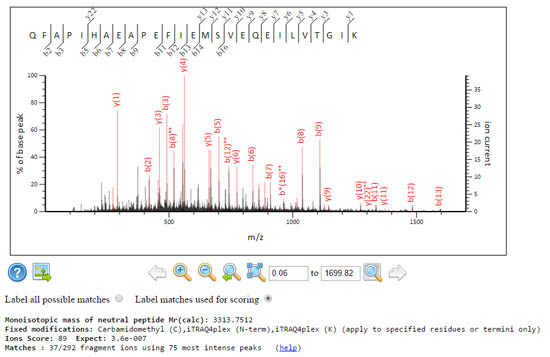
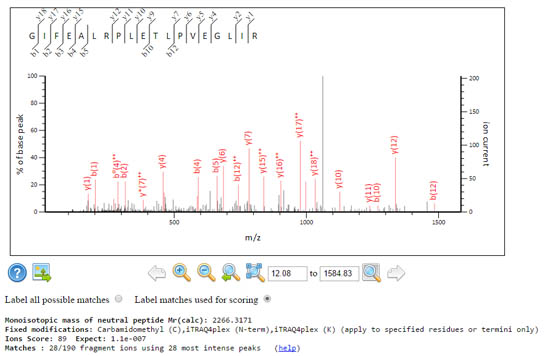
When you look at the details of a peptide match in the Mascot Peptide View report, only a small number of the peaks may be labelled in the spectrum graphic and highlighted in the table of fragment masses. We often got challenged about this: "Why haven’t you labelled these other peaks that clearly match?". So, in Mascot 2.3, we added the radio buttons that allow you to switch between labelling the matches used for scoring and labelling all the matches. But, why is it that only a subset of all possible fragment matches are used for scoring?
Even high-performance instruments can give spectra with ‘peak at every mass’ chemical noise. If a search engine simply counted fragment matches, such spectra would give high scores for almost any sequence. Clearly, there has to be some attempt to descriminate between signal and noise, and you cannot just take the most intense peaks in the spectrum because there are often strong systematic intensity variations across the mass range. Low mass fragments may be much more intense than high mass fragments. The approach taken in Mascot is to divide the spectrum into 110 Da wide segments and take the most intense peak in each segment. The score for this set of peaks is determined, then next most intense peak in each segment is added to the set and the score re-determined. It continues to iterate, taking additional peaks from each segment, until it is clear that the score can only get worse. The best score found is reported, which hopefully corresponds to an optimum selection, taking mostly real peaks and leaving behind mostly noise.
The rationale for using segments of width 110 Da is that this is the weighted average amino acid residue mass in a database such as SwissProt. We cannot be sure which ion series will be present in a spectrum, but it would seem reasonable to assume that the number of real peaks will be some small multiple of the number of 110 Da intervals.
As more peaks are selected, the number of fragment matches may keep increasing, but at some stage, the score will start to decrease. This is because Mascot scoring is probability based; the number of trials matters as much as the number of matches – trials being the number of experimental peaks selected. Getting 12 matches from 20 peaks will usually give a higher score than 14 matches from 30 peaks, although you cannot say for sure without taking parameters such as mass tolerance and the number of possible matches into account. Peptide view always reports these numbers alongside the score, so that you can tell how deep the algorithm had to to dig to get the matches. These two spectra get the same score, but the signal to noise characteristics are rather different.


This approach to selecting peaks in not super-sophisticated, but it is rugged and can handle a wide range of data characteristics. We’ve always been reluctant to attempt too much processing on the peak list because what works well in one case can cause damage in other cases. Messing with the peak list can never be a substitute for good peak picking, which is also the correct place for de-charging and de-isotoping of high quality MS/MS data. An earlier blog article described how you can control the removal of the precursor isotope peaks and the centroiding that is used as a last line of defence against profile data.
Keywords: peak picking, scoring, statistics