Tutorial: Selecting the best DeepLC model
Mascot Server 3.0 can refine database search results using predicted retention times. The predictions are provided by DeepLC, and Mascot ships with twenty models for different gradient lengths, column types and peptide properties. This tutorial shows how to select the best model for your experiment.
What is DeepLC?
DeepLC is a retention time predictor that uses a convolutional neural network (deep learning) architecture. The 2021 publication in Nature Methods has a very good description of the architecture and the design choices. In short, DeepLC uses the atomic composition as well as an amino acid encoding in predicting retention. This allows it to make accurate preditions for previously unseen modified peptides.
What is the goal of RT prediction in Mascot?
Predicted retention time is one of many features used in separating correct from incorrect matches. Specifically, the feature for refining purposes is the difference between predicted and observed retention time. It is potentially a very powerful feature, because retention time is orthogonal to metrics calculated from the MS/MS spectrum. When a suitable DeepLC model is chosen, the RT difference of incorrect matches is expected to be widely spread, while the RT difference of correct matches will cluster around zero. This kind of clustering is perfect for Percolator’s semi-supervised learning.
How do I use DeepLC?
Check first that retention time is included as RTINSECONDS in your MGF file. It is not sufficient to have retention time in the scan title. Mascot Distiller provides suitable input. If using mzML, Mascot looks for the CV (controlled vocabulary) terms MS:1000016 and MS:1000826.
An easy way to check is to open your search results, select a significant peptide match and look for the raw query information at the top of the Peptide View report. If the line contains “rtinseconds”:
  Match to Query 244: 741.448728 from(371.731640,2+) intensity(325195.44)
    scans(4802) rawscans(sn4802) rtinseconds(2802.2659) index(3027)
Then retention times are correctly encoded and you can use DeepLC.
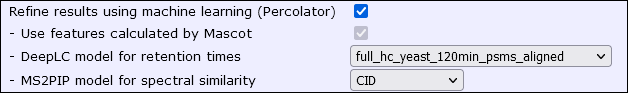
Mascot Server 3.0 integrates with MS2Rescore, which includes DeepLC as one of its components. The DeepLC neural network must be trained before use, but Mascot Server 3.0 ships with 20 pretrained models. After the database search is finished, select a model from format controls in the results report:
What is the DeepLC model naming convention?
Mascot uses the same model names as the upstream version of DeepLC. The naming convention is described in the DeepLC GitHub page:
[full_hc]_[dataset]_[fixed_mods]_[hash].hdf5
All models included in Mascot have the prefix “full_hc”, which simply means it’s a trained and fully optimised model. The [dataset] is the short name of the data set used in training the model. “fixed_mods” is a flag: if present, amino acids with fixed modifications were presented to the neural network as normal amino acids, without indicating they carry a modification. The [hash] is an implementation detail.
Because model naming is a bit opaque, Mascot includes a table that enumerates more relevant attributes like gradient length to help with model selection.
How do I choose good a model?
First, make sure your chromatography is reproducible and consistent. If it isn’t, then no amount of machine learning will make the data better.
Collect sufficient information about your sample. How long was the gradient and was it reversed phase (RP), HILIC or something else? Did you use isobaric quantitation (TMT/iTRAQ), metabolic quantitation (SILAC) or neither? Is the sample enriched for a specific modification like phosphorylation?
The DeepLC developers recommend full_hc_PXD005573_mcp as a starting point. This was trained on human tryptic peptides with fixed Carbamidomethyl (C) and the very commonly occurring variable mods Oxidation (M) and Acetyl (Protein N-term). Column type is reversed phase (RP), 2h elution. If these are your experimental conditions, the model is a very good fit.
DeepLC is actually quite lenient when the conditions aren’t an exact match, so full_hc_PXD005573_mcp is typically a good choice even if one of the factors is different, for example: elution is a bit shorter or longer than 2h; or peptides are from a different species; or modifications are slightly different but still chemically similar to the training data. However, the more your conditions diverge from the training data, the less accurate the predictions.
Although Mascot ships with 20 models, there is no need to try every one of them in turn. Here’s the recommended procedure:
- From the table of DeepLC models, make a shortlist of candidates by excluding models with unsuitable column type.
- Then, exclude models whose gradient is very different from yours. If your gradient is 30 minutes, the 1h models will be better than the 2h or 4h models. Conversely, if you use a long gradient, avoid models that were trained on shorter gradients.
- Finally, inspect the peptide properties used in the training set. If your sample has TMT labels or phosphorylation, include those models in your shortlist. If there doesn’t seem to be any perfectly fitting model, you won’t be able to exclude any further models and you need to try a few.
When you select a model, there are two key metrics to check that it’s suitable. Go to the machine learning quality report and open the Rescoring features tab.
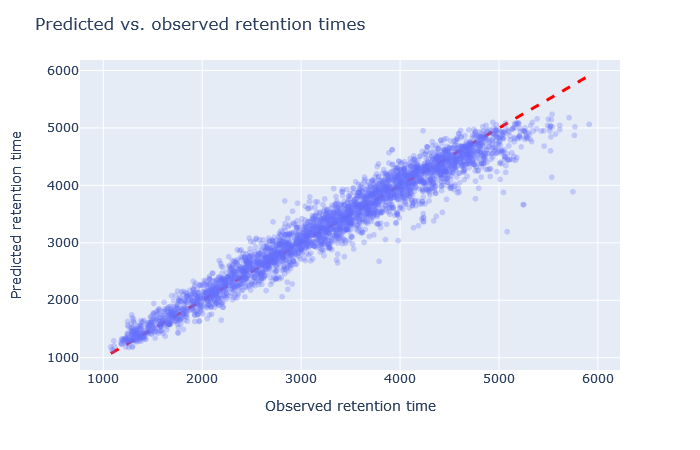
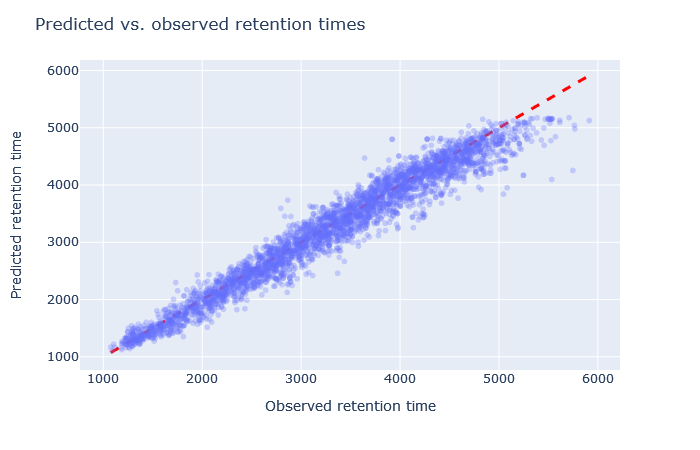
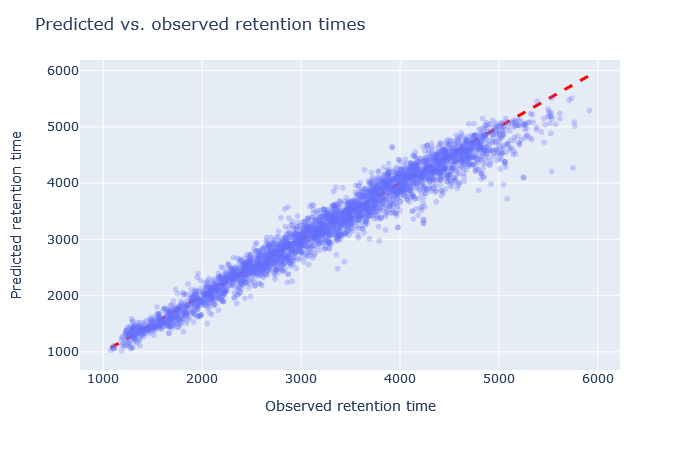
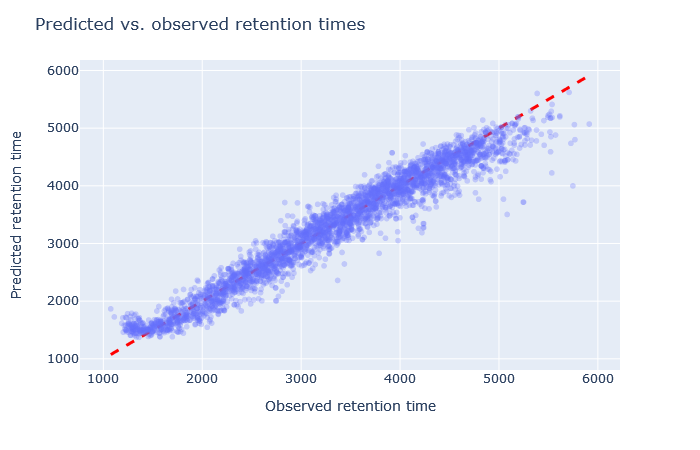
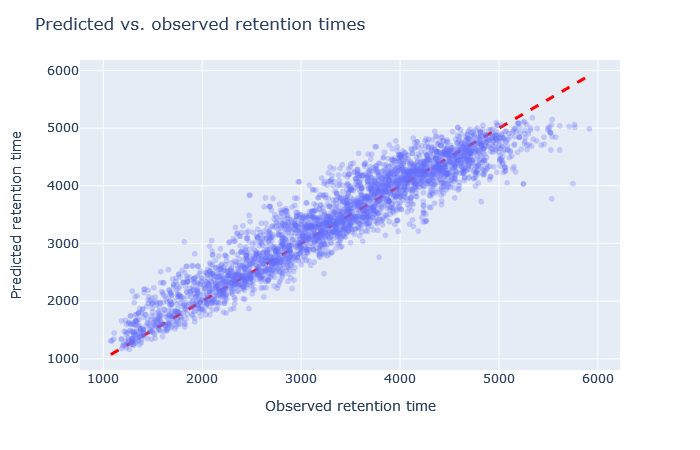
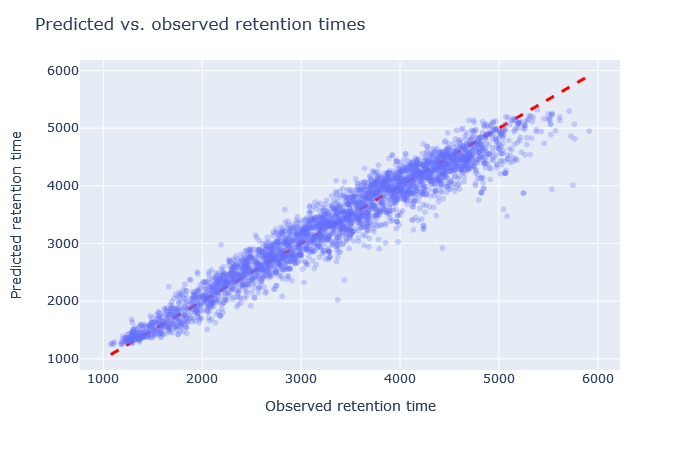
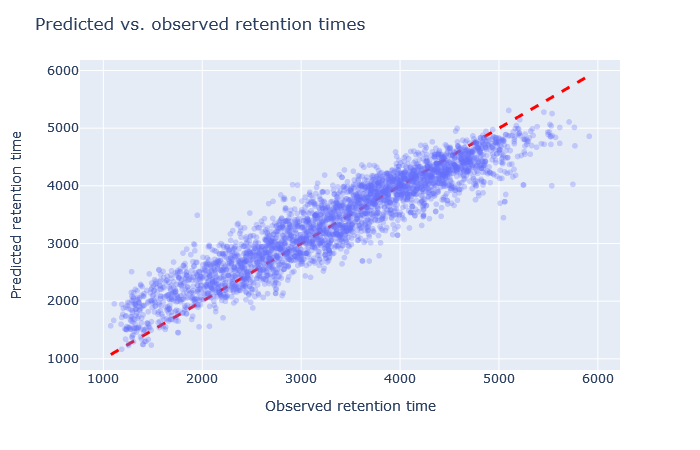
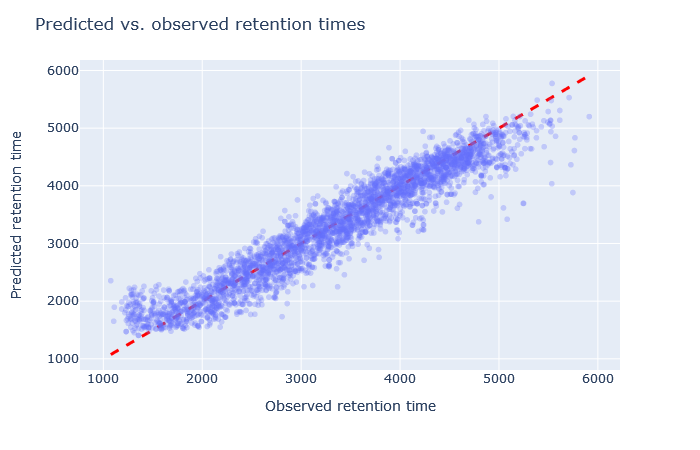
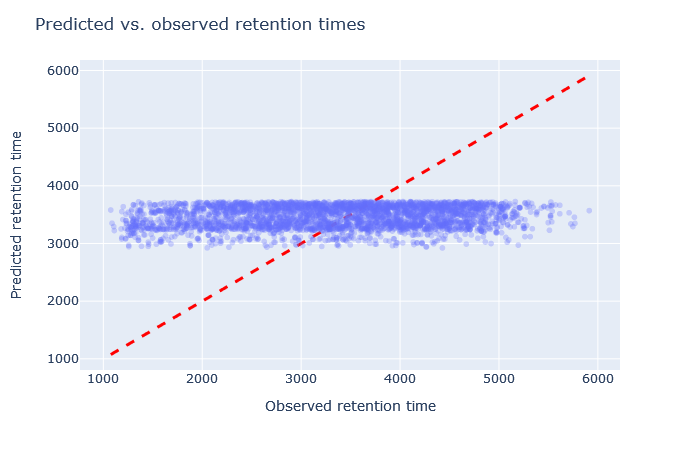
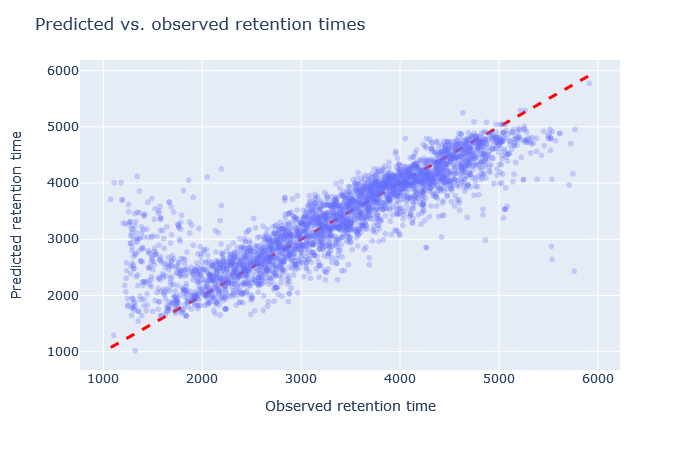
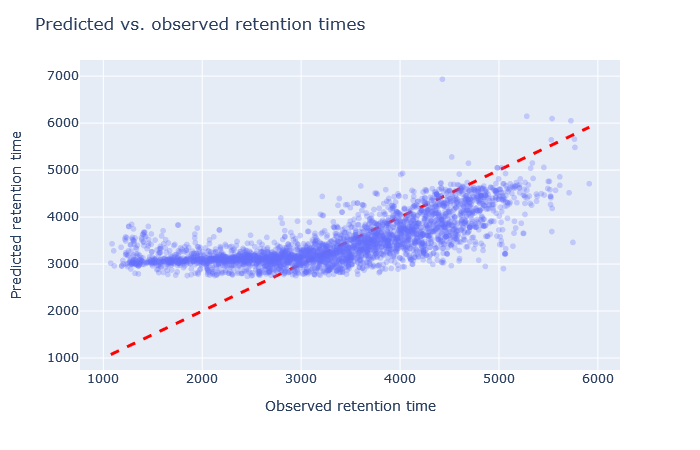
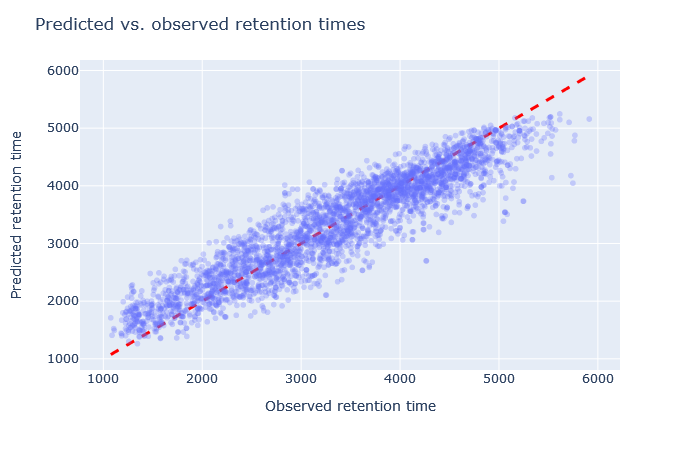
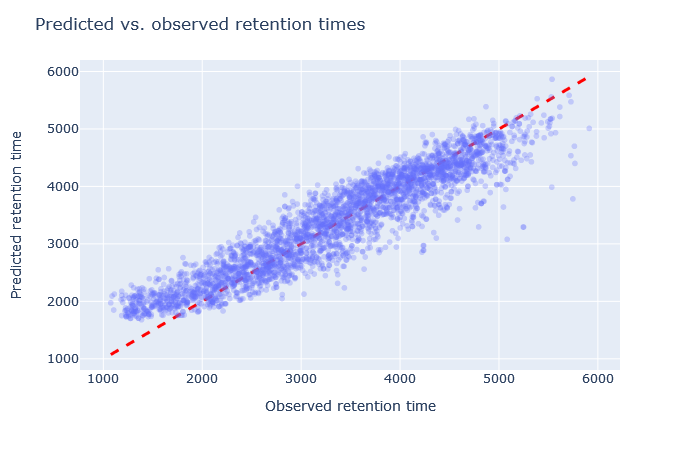
Check the scatterplot of predicted vs. observed retention time: Do the predictions fall on the diagonal line? If they deviate, how much scatter is there? Are predictions at the start and end of the gradient also on the diagonal?
Check the relative mean absolute error (RMAE): How does your data set compare with a selection of DeepLC benchmark data sets? Typically, RMAE below 2% is the goal, while RMAE around 3-5% can still be acceptable. If the relative error exceeds 5%, this is typically visible in the scatterplot as large amount of scatter or non-linear behaviour.
Once you have found a suitable model for your experimental conditions, there is no need to repeat the procedure. Just save the model in Daemon parameter editor as the default, or save it as a cookie as a search form default. Use the same model for future database searches.
What happens if I choose a wrong model?
If you choose a badly fitting model, the good news is that it rarely makes your results worse. For example, if the model predicts the same retention time for every peptide, then the RT difference for target and decoy matches has extreme scatter. Percolator simply won’t use the RT difference for separating correct from incorrect matches (because the RT dimension provides no separation).
Although there is a ‘best’ model for every data set, most of the DeepLC models produce acceptable results for a wide range of data sets. Have a look at figure S-7 in supplementary information of the the 2021 DeepLC publication. The authors calculated the correlation between predicted and observed retention times for every model applied to every data set used in training. The most important metric for good fit is the column type – retention times from SCX are very different from RP, which are different from HILIC. But beyond that, most of the RP models perform acceptably with most of the RP data sets.
To illustrate the same, the table below tabulates RMAE and the RT scatterplot for every model shipped with Mascot. The data set is the CPTAC yeast example search used in the August blog article.
The number of significant unique sequences is taken at 1% sequence FDR. The baseline performance is with refining enabled and neither DeepLC nor MS2PIP model selected, which yields 2740 significant sequences. So, the relative increase in sig. unique sequences in the table is purely down to DeepLC.
| Model | Sig. unique sequences |
RMAE | Scatterplot | |
|---|---|---|---|---|
| full_hc_unmod_fixed_mods | 2979 (+8.7%) | 3% |
|
(results report) |
| full_hc_dia_fixed_mods | 2971 (+8.4%) | 3% |
|
(results report) |
| full_hc_hela_lumos_2h_psms_aligned | 2947 (+7.6%) | 2.5% |
|
(results report) |
| full_hc_hela_hf_psms_aligned | 2943 (+7.4%) | 4% |

|
(results report) |
| full_hc_hela_lumos_1h_psms_aligned | 2927 (+6.8%) | 3% |
|
(results report) |
| full_hc_mod_fixed_mods | 2888 (+5.4%) | 4% |
|
(results report) |
| full_hc_plasma_lumos_2h_psms_aligned | 2874 (+4.9%) | 4% |

|
(results report) |
| full_hc_PXD005573_mcp | 2851 (+4.1%) | 3.5% |
|
(results report) |
| full_hc_prosit_ptm_2020 | 2827 (+3.2%) | 5% |

|
(results report) |
| full_hc_plasma_lumos_1h_psms_aligned | 2805 (+2.4%) | 5% |
|
(results report) |
| full_hc_yeast_120min_psms_aligned | 2778 (+1.4%) | 4% |
|
(results report) |
| full_hc_ATLANTIS_SILICA_fixed_mods | 2777 (+1.4%) | 14% |
|
(results report) |
| full_hc_pancreas_psms_aligned | 2772 (+1.2%) | 5.5% |
|
(results report) |
| full_hc_arabidopsis_psms_aligned | 2767 (+0.9%) | 10% |
|
(results report) |
| full_hc_PXD008783_median_calibrate | 2746 (+0.2%) | 5% |
|
(results report) |
| full_hc_yeast_60min_psms_aligned | 2723 (-0.7%) | 5% |
|
(results report) |
| full_hc_SCX_fixed_mods | 2693 (-1.8%) | 13% |
|
(results report) |
| full_hc_Xbridge_fixed_mods | 2678 (-2.3%) | 13% |
|
(results report) |
The default model, full_hc_PXD005573_mcp, is pretty good. It was trained on 2h gradient of human peptides and the CPTAC yeast data set used 135min gradient. Fixed and variable modifications are the same. The scatterplot is tight and RMAE only 3%. Although the default model doesn’t give the highest count of unique sequences, it is a decent starting point.
The best choice, in terms of unique sequences, turns out to be full_hc_unmod_fixed_mods, which was trained on a 4h gradient. The difference between the scatterplots and RMAE is not big compared to full_hc_PXD005573_mcp, but there is some (unknown) factor in the training data that makes the model a good predictor for the CPTAC yeast data.
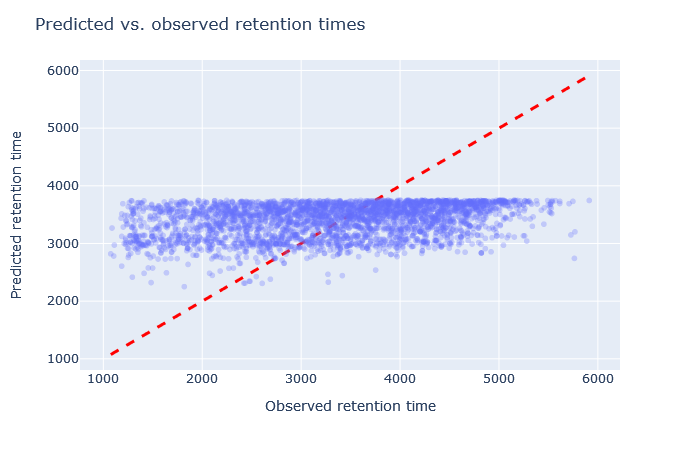
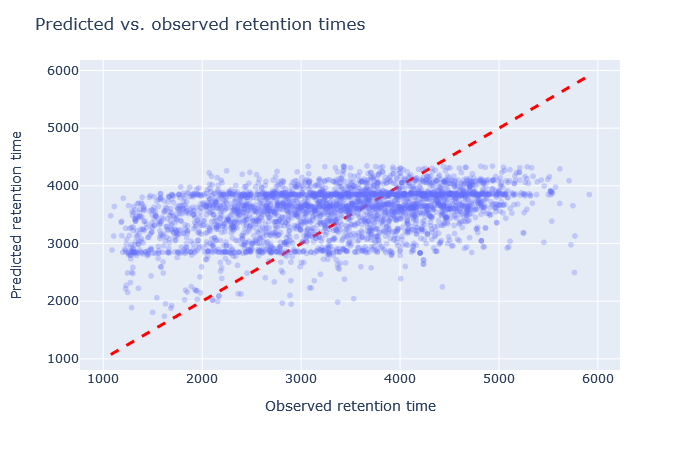
Sometimes it’s very obvious that the selected model is wrong. For example, although full_hc_plasma_lumos_2h_psms_aligned has RMAE 4%, the predictions at the start and end of elution are not very good, and it’s not a suitable model for the data set. Among the worse fitting models, it’s important to look at both the shape of the scatterplot and the RMAE, as neither one alone is a sufficient metric. If the scatterplot looks like a hockey stick or worse, exclude it from further consideration.
Keywords: DeepLC, machine learning, Percolator, retention time