Tutorial: Selecting the best MS2PIP model
Mascot Server 3.0 can refine database search results using predicted fragment intensities. The predictions are provided by MS2PIP, and Mascot ships with suitable models for common instrument types. This tutorial shows how to select the best model for your instrument and experiment.
What is MS2PIP?
MS2PIP is a tool for predicting the MS/MS fragmentation spectrum from a peptide sequence, charge state and fixed/variable modifications. Specifically, MS2PIP predicts the intensities of the most common types of fragment ions: b, y, b++ and y++.
The predictions are made by training a model from large amounts of peptide-spectrum matches provided by a traditional search engine, like Mascot. MS2PIP uses random forest regression, which is described in the original publication. The later publications include further refinements.
What is the goal of peak intensity prediction in Mascot?
Mascot probability-based scoring uses peak intensities for discriminating signal from noise. The spectrum is divided into 100Da windows, and in each window, up to ten high-intensity peaks are selected for matching and scoring. Mascot aims to explain the largest amount of observed intensity using different combinations of ion series. However, the peptide match score is based on fragment mass matches. Although peak intensities influence the score indirectly, they are not part of the Mascot ions score.
Predicted fragment intensities are used when refining the results after the database search. Specifically, the relevant feature is the correlation between the predicted and observed spectrum. When a suitable MS2PIP model is chosen, the spectral correlation for incorrect matches is expected to be widely spread, while the correlation for correct matches will be near 1.0. This kind of clustering is perfect for Percolator’s semi-supervised learning.
How do I use MS2PIP?
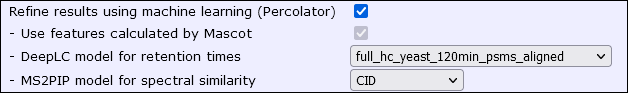
Mascot Server 3.0 integrates with MS2Rescore, which includes MS2PIP as one of its components. MS2PIP must be trained before use, but Mascot Server 3.0 ships with 13 pretrained models. After the database search is finished, select a model from format controls in the results report:
How do I choose good a model?
Collect sufficient information about your sample. What was the instrument make and model? Did you use isobaric quantitation (TMT/iTRAQ), metabolic quantitation (SILAC) or neither? Are the peptides tryptic or semi-tryptic or endogenous? Is the sample enriched for a specific modification like phosphorylation?
Then, consult the MS2PIP help page and pick a model that best fits your instrument and enzyme.
The CID model is often a great starting point. It was trained on the high quality NIST CID Human spectral library, which is a curated selection of consensus spectra from a large number of CID instruments. The MS2PIP model is, therefore, trained to capture the general rules of CID fragmentation across all instrument types.
If you used iTRAQ labeling, choose either the iTRAQ model or iTRAQphospho. Although these were trained on Orbitrap spectra, the label alters the peptide fragmentation a lot more than the instrument type, so these models should be adequate for non-Orbitrap instruments as well.
If you used TMT labeling, choose the TMT model or CID-TMT. The TMT labels are the key property for accurate MS/MS prediction. Although the model was trained on Orbitrap data, it should be adequate for non-Orbitrap instruments too. The CID-TMT model is a special case for spectra acquired using MS3.
If you used a Thermo Orbitrap, one of the HCD models is the best choice. HCD2019 is a good default for tryptic peptides, while Immuno-HCD or HCD2021 is suitable for non-tryptic peptides. If you used a Sciex instrument, the TTOF5600 provides good predictions for both Sciex 5600 and 6600 instruments. And if you used a Bruker timsTOF, choose either timsTOF2023 or timsTOF2024.
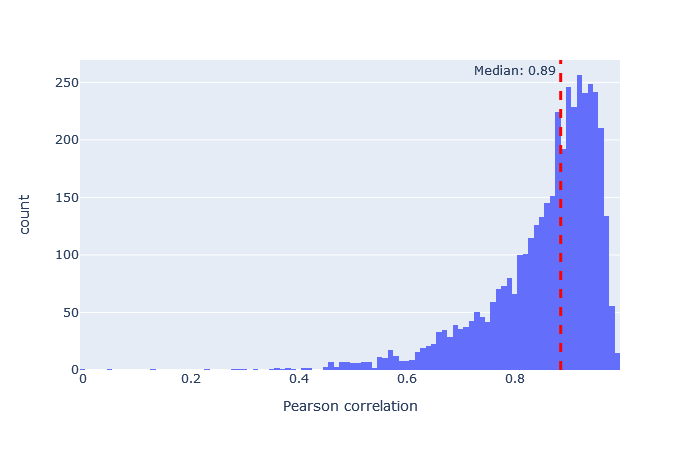
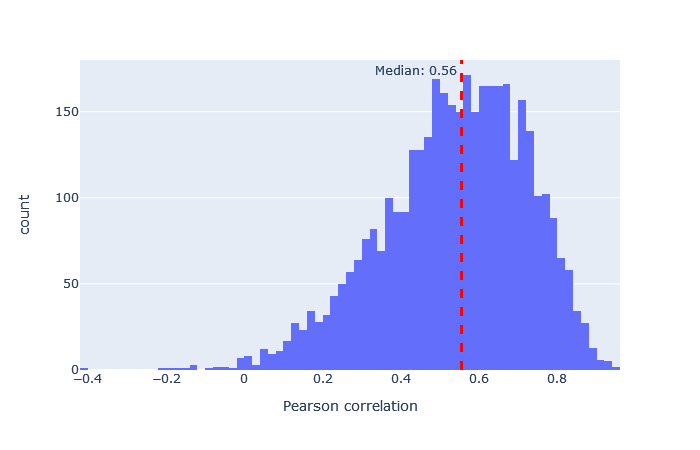
After selecting a model, the key metric is the correlation between the predicted and observed spectra. Go to the machine learning quality report and open the Rescoring features tab. The MS2PIP model performance is a histogram of the Pearson correlation between predicted and observed fragments (this is the spec_pearson_norm feature). A median correlation above 0.85 is great, and ideally most of the ‘mass’ of the histogram should be clustered between 0.8 and 1.0.

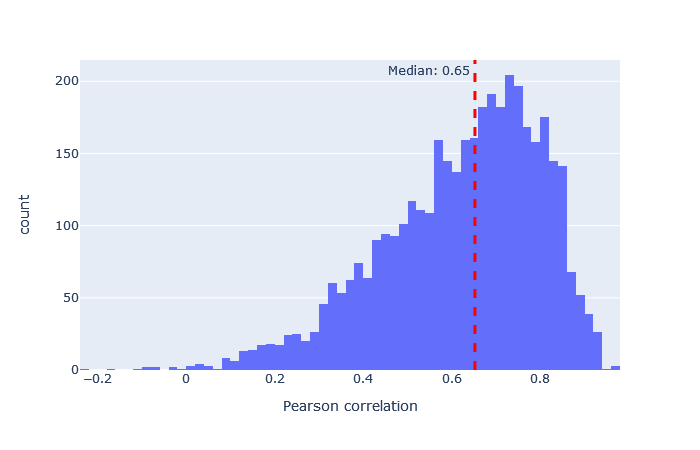
If the median correlation is lower, or if there is very wide spread or multiple histogram peaks, try a different model. Examples of both good and bad model fit are further below.
Once you have found a suitable model for your experimental conditions, there is no need to repeat the procedure. Just save the model in the Daemon parameter editor as the default, or save it as a cookie as a search form default. Use the same model for future database searches.
What does a predicted spectrum look like?
MS2PIP returns a short array of m/z values for the b and y ions and the predicted intensity for each ion. The predicted intensities are normalised to the range (0.0, 1.0). The predicted spectra are currently not shown in Mascot, but you can use the online version of MS2PIP to plot the prediction for a single peptide.
Suppose to want the predicted spectrum for DAGTIAGLNVLR, 2+, which is query 4220 in the example search. Go to https://iomics.ugent.be/ms2pip/#run for the online MS2PIP server. (Mascot does not use the server hosted at iomics.ugent.be — but it runs the same versions of the models as shipped with Mascot.) Select the relevant fixed/variable modifications and the desired model. In this case, choose CID. Save the following lines as my_peptide.peprec, which provides the peptide properties:
spec_id modifications peptide charge
DAGTIAGLNVLR_2 - DAGTIAGLNVLR 2
Select it as your PEPREC file, set output format to CSV and click Start. After a while, you should be redirected to the result page, which shows a plot of the predicted spectrum as well as the predictions in CSV format.
Compare the observed spectrum from Mascot with the predicted spectrum, shown below.

Observed spectrum for DAGTIAGLNVLR, 2+
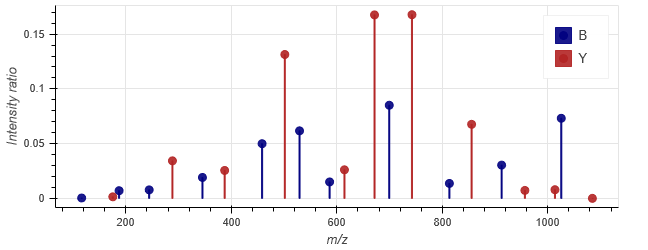
Predicted spectrum for DAGTIAGLNVLR, 2+ using the CID model
Not bad! The b ions that are present have relative intensities quite close to the observed ones. With y ions, the peaks annotated by Mascot show a ions in addition to b and y. A few peaks, like a6/y4 and a8/y6, match the same observed peak within fragment tolerance, in this case 0.6Da, and Mascot annotates them as a ions. However, the relative intensity of a6/y4 at 501.3144 m/z is pretty close to the prediction, and so is the relative intensity of a8/y6.
It’s obviously infeasible to do a visual check for more than a few spectra, so there must be some other way to evaluate the model choice.
What happens if I choose a wrong model?
If you choose a badly fitting model, the good news is that it rarely makes your results worse. For example, if the model predicts the same fragmentation pattern for every peptide, then the spectral correlation for target and decoy matches has extreme scatter. Percolator simply won’t use it for separating correct from incorrect matches (because the correlation dimension provides no separation).
Predicting fragmentation spectra for non-tryptic peptides using a tryptic model is possible but might not be accurate. On the other hand, a model trained on semi-tryptic or endogenous peptides typically has good performance when predicting spectra for tryptic peptides.
The table below tabulates Pearson correlation for every model shipped with Mascot. The data set is the CPTAC yeast example search used in the August blog article, which was acquired with a Thermo LTQ-XL-Orbitrap.
The number of significant unique sequences is taken at 1% sequence FDR. The baseline performance is with refining enabled and neither DeepLC nor MS2PIP model selected, which yields 2740 significant sequences. So, the relative increase in sig. unique sequences in the table is purely down to MS2PIP.
| Model | Sig. unique sequences | Median correlation | Histogram | |
|---|---|---|---|---|
| CID | 3514 (+28%) | 0.89 |
|
|
| CIDch2 | 3514 (+28%) | 0.89 |
|
|
| TTOF5600 | 3311 (+21%) | 0.65 |
|
|
| HCD2019 | 3257 (+19%) | 0.56 |
|
|
| HCDch2 | 3257 (+19%) | 0.56 |

|
|
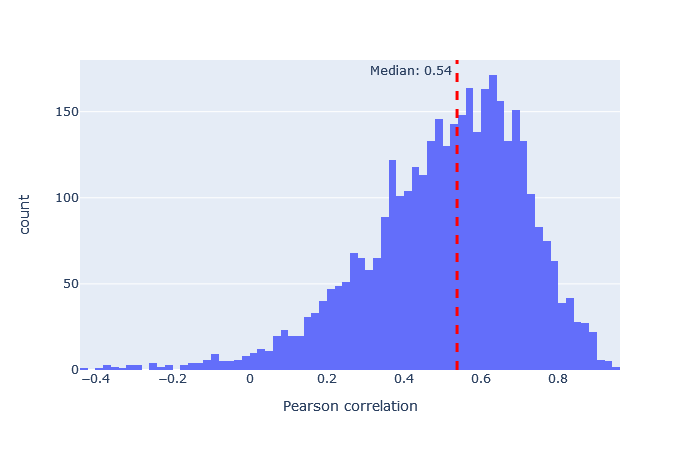
| HCD2021 | 3157 (+15%) | 0.54 |
|
|
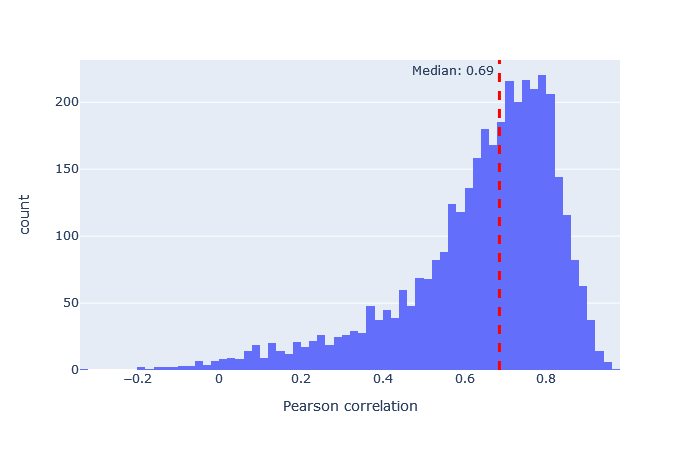
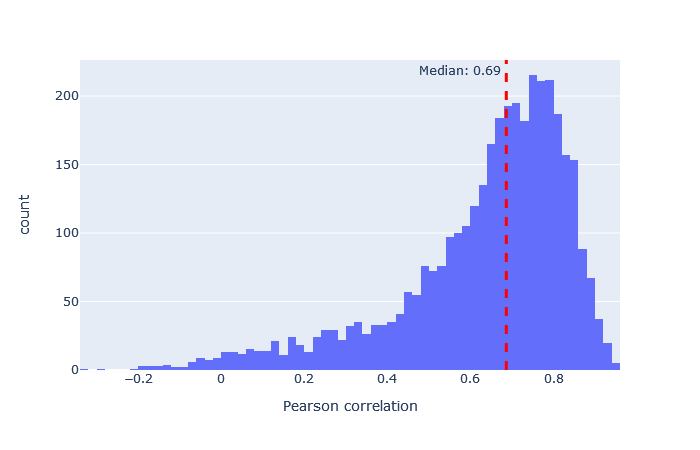
| timsTOF2024 | 3149 (+15%) | 0.69 |
|
|
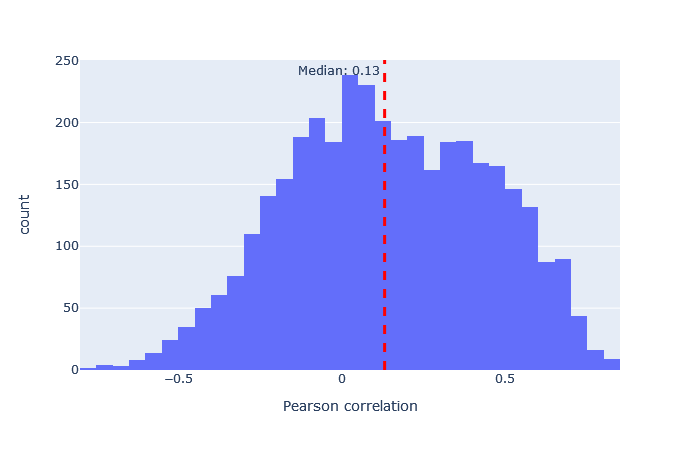
| TMT | 3130 (+14%) | 0.13 |
|
|
| timsTOF2023 | 3121 (+14%) | 0.69 |
|
|
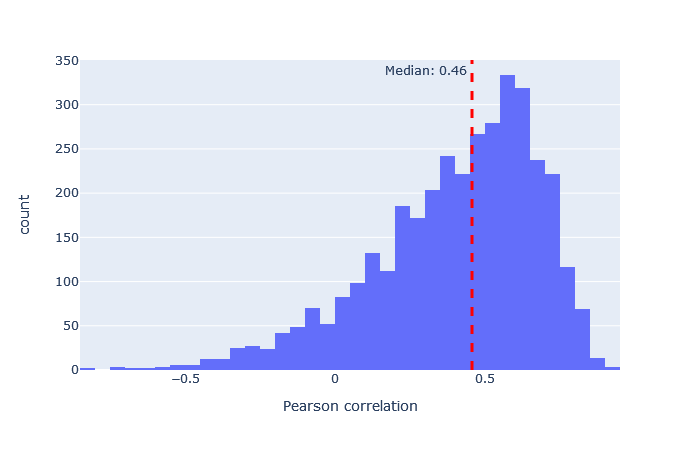
| CID-TMT | 3119 (+14%) | 0.46 |
|
|
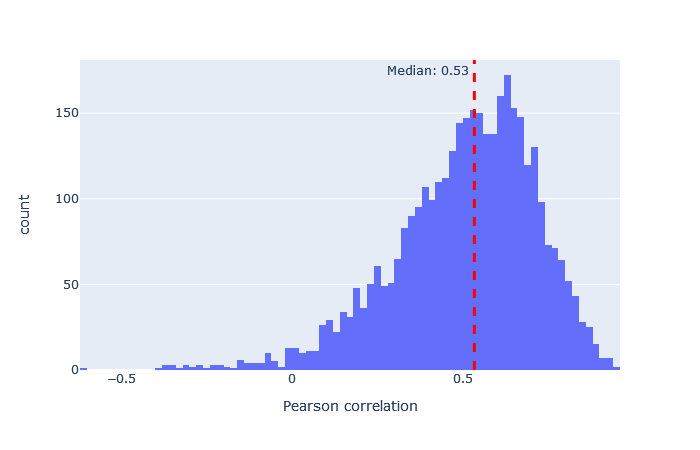
| Immuno-HCD | 3053 (+11%) | 0.53 |
|
|
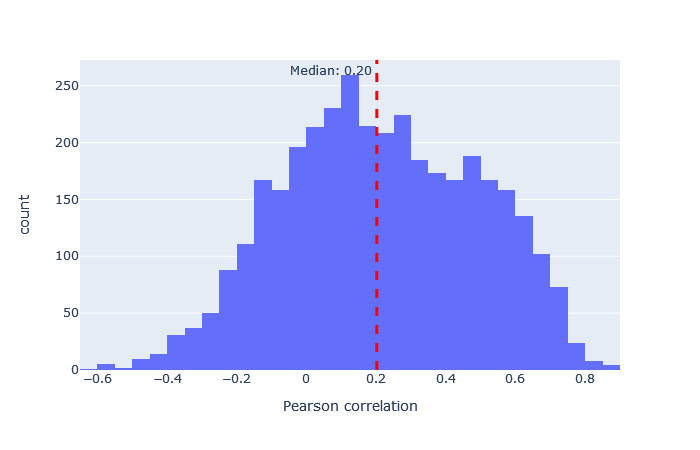
| iTRAQ | 3015 (+10%) | 0.20 |
|
|
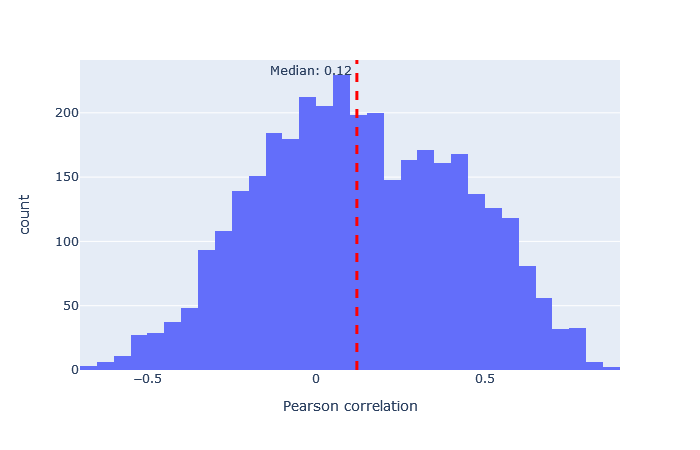
| iTRAQphospho | 2939 (+7%) | 0.12 |
|
It’s interesting that even a very badly fitting model appears to give a small boost to the number of unique sequences at 1% sequence FDR. For example, the correlation histogram for iTRAQphospho is distributed almost symmetrically about 0, indicating the predictions are mainly random, but there are a small number of peptides where the prediction is just good enough to skew the distribution a bit towards the right. This difference seems to be just enough for Percolator to use as a separating factor between correct and incorrect matches, when used in combination with the core features calculated by Mascot. The difference between the worst and best fitting model is so large that you should obviously always choose the best fitting model.
Keywords: machine learning, MS2PIP, Percolator