Using machine learning with Mascot and Proteome Discoverer
Update: There is a newer version of this article, Identify more proteins using Mascot and Proteome Discoverer with this one small trick. The PD setup instructions have been updated accordingly.
Mascot Server 3.1 is a patch release that enhances integration with Thermo Proteome Discoverer™ and fixes a few important bugs introduced in Mascot Server 3.0. The full list of improvements and changes is in the release announcement. The Proteome Discoverer integration is particularly noteworthy, as you can now import refined results directly from Mascot into PD. This can easily give you 50% more peptide identifications and a corresponding increase in identified proteins.
How it works
Mascot Server 3.0 introduced two new search parameters: PERCOLATE and ML_ADAPTER_PARAM. These parameters are typically set in the search form or in the results report after the search. They enable refining (PERCOLATE) and optionally select a DeepLC or MS2PIP model (ML_ADAPTER_PARAM) for predicted features.
Proteome Discoverer does not currently have a user interface for either parameter. The workaround, implemented in Mascot Server 3.1, is to encode them as part of the instrument configuration. When you submit the search from PD, just select the new instrument (for example, “MS2PIP:HCD2021″). At the end of the search, Mascot refines the results with machine learning and sends the refined data to PD.
At the time of writing, the integration has been tested with PD 2.4, PD 3.1 and PD 3.2. We believe it will work with all versions of PD (1.4, 2.x, 3.0, 3.1 and 3.2), because the API and data formats have been stable for many years.
Example: QC DDA run of human, yeast, E. coli mixture (PXD028735)
PRIDE project PXD028735 is raw data for A comprehensive LFQ benchmark dataset on modern day acquisition strategies in proteomics (Pyuvelde et al., Scientific Data, 9(126), 2022). The authors used six instruments and six different mixtures of yeast, E. coli and human proteins. Every sample was run with every instrument using DDA. We downloaded one of the QC replicates, LFQ_Orbitrap_DDA_QC_03.raw, which was run on Thermo Orbitrap QE HF-X (Nano flow LC). There’s nothing special about this raw file; it was selected arbitrarily and you will get similar results with other raw files too.
In Mascot Server 3.1, set up a new instrument MS2PIP:HCD2021, where refining is enabled and the MS2PIP model HCD2021 is selected. The instructions are in Using machine learning with Mascot Server 3.1 and Proteome Discoverer (4 pages, 254 kB).
In Proteome Discoverer, create a new study. Use the consensus workflow template ConsensusWF \ CWF_Basic.pdConsensusWF. For the processing workflow, set up Mascot as shown in the diagram below:
![Mascot processing workflow in Proteome Discoverer: [Spectrum Files] to [Spectrum Selector] to [Mascot] to [Target Decoy PSM Validator]](/images/Mascot_PD_processing_workflow_TD_validator.png)
That is, connect Spectrum Files to Spectrum Selector, then feed it to Mascot. Finally, validate using the Target Decoy PSM Validator. Set the Target Decoy PSM Validator strategy to Separate.
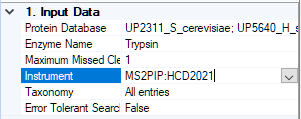
We used the following search parameters for Mascot. The databases are standard predefined definitions enabled in Mascot’s Database Manager.
- Protein Database: UP2311_S_cerevisiae, UP5640_H_sapiens, UP625_E_coli_K12
- Enzyme Name: Trypsin
- Maximum Missed Cleavages: 1
- Instrument: MS2PIP:HCD2021
- Taxonomy: All entries
- Error Tolerant Search: False
- Precursor Mass Tolerance: 10 ppm
- Fragment Mass Tolerance: 20 ppm
- 1. Dynamic Modification: Oxidation (M)
- 1. Static Modification: Carbamidomethyl (C)
The rest of the processing settings and the consensus settings can be left at defaults.
The instrument choice defines whether machine learning is used. In this case, make sure it’s MS2PIP:HCD2021:
Almost 60% more peptide matches in PD 3.1
The below table summarises the protein and peptide counts when using Mascot Server 3.1 with the HCD2021 model, and Proteome Discoverer 3.1.
| Mascot | PD | Protein Groups | Peptide Groups | Threshold |
|---|---|---|---|---|
| 3.0 (no ML) | PD 3.1 | 4,635 | 21,507 | Expect value: 0.87 |
| 3.1 (with ML) | PD 3.1 | 5,898 | 34,141 | Expect value (PEP): 0.1256 |
The effective threshold can be found in the result viewer: In the PSMs tab, sort by Expect Value and find the largest value. With Mascot Server 3.0 and refining disabled, the target-decoy validator has to accept a lot of matches of dubious quality between expect values 0.05 and 0.87 in order to reach 1% FDR.
With Mascot Server 3.1 and refining enabled, the target-decoy validator has a more sensible threshold. Not only is Proteome Discoverer detecting more matches, the matches are statistically more reliable. Note that, when the workaround is active, the value in the Expect column is equivalent to the posterior error probability (PEP) estimated by Percolator.
Over 100% more peptide matches in PD 2.4
We also ran the same workflow and same raw file in Proteome Discoverer 2.4.
| Mascot | PD | Protein Groups | Peptide Groups | Threshold |
|---|---|---|---|---|
| 3.0 (no ML) | PD 2.4 | 4,235 | 17,106 | Expect value: 0.1675 |
| 3.1 (with ML) | PD 2.4 | 6,100 | 35,047 | Expect value (PEP): 0.09976 |
There are some differences between PD 2.4 and PD 3.1 due to the PD protein inference algorithm and any changes in the Target Decoy PSM Validator node between the versions. The drastic increase, over 100%, in Peptide Groups is partly explained by how the Mascot node calculates the score threshold.
In PD 2.4, the Mascot node only uses the identity threshold, while PD 3.1 uses the homology threshold. The homology threshold is an empirical threshold, and it usually gives much better sensitivity at a given FDR. This is obvious from comparing the unrefined results between PD 2.4 (17,106 Peptide Groups) and PD 3.1 (21,507 Peptide Groups).
When Mascot refines the results, it encodes -10log10(PEP) as the “Mascot score”, and hardcodes 20 as the identity threshold, equivalent to PEP 0.01. Comparing the refined results between PD 2.4 (35,047 Peptide Groups) and PD 3.1 (34,141 Peptide Groups) shows much less difference, because both are now using the same type of threshold.
Keywords: machine learning, MS2PIP, Percolator, Proteome Discoverer